Alam
🧑💻Data Science Portfolio by Mohamad Alamsyah
Tableau | GitHub | LinkedIn » Project Summary (DAxPM)
Hello!👋 I’m Alam, a biomedical engineering fresh graduate from Indonesia 🇮🇩 I’ve been creating projects in healthcare, business, and more along the journey–all of which are compiled here. Thanks for checking in, and hope you enjoy!
Hospital Inpatient Discharges New York, 2020-2023
🔗Tableau 🏷️data-analysis dashboarding hospital Tableau
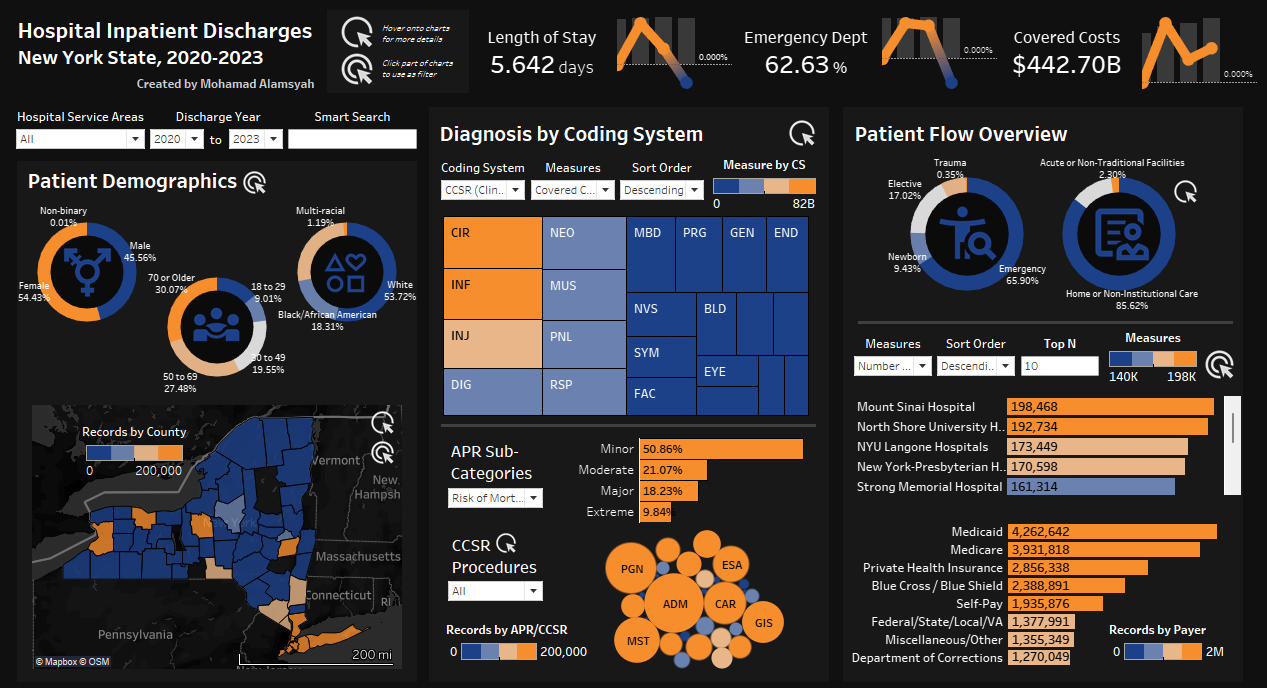
- Developed a dashboard from 8.4M+ data of de-identified hospital inpatient discharges in New York with Tableau to explore insights, featuring patient demographics, diagnosis by coding system, patient flow overview
- Calculated three metrics with YoY growth in healthcare quality: Length of Stay, Emergency Department, and Total Covered Cost, mapped groups of diagnosis by ICD-10-CM body system for health workers, and created filters to enable further details, notably hospital service areas, discharge year, patient cohort, and demographics
Influencer Marketing Campaign Dashboard
🔗Dataset Report 🏷️data-analysis marketing Excel PowerQuery
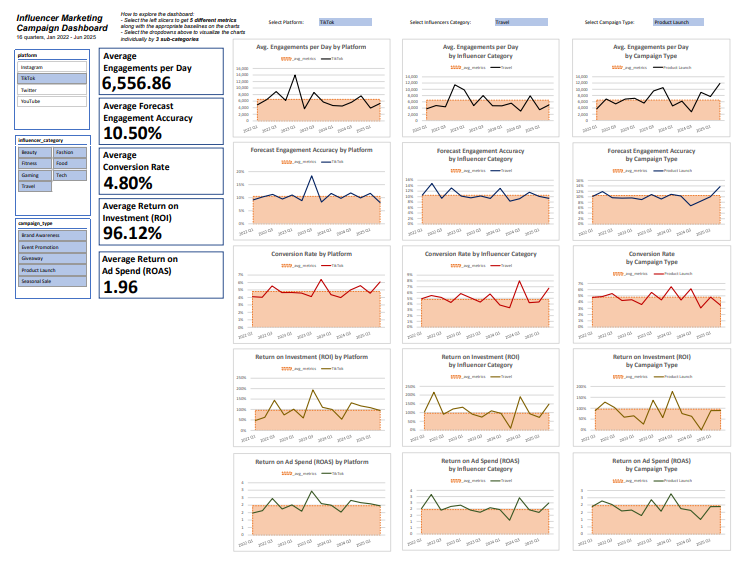
- Developed a dashboard from a 4-year data of influencers marketing campaign in Excel to track quarterly performance with notable metrics such as Conversion Rate, ROI, and ROAS
- Grouped the data with PowerQuery into tables by 3 different categories of Platform, Influencers Category, and Campaign Type, added dropdowns and slicers to provide baselines, filter individual charts, and compare metrics
Market Research: AI Startup in Skincare At Malaysia
🔗Dataset Python Report 🏷️data-analysis market-research excel PowerQuery
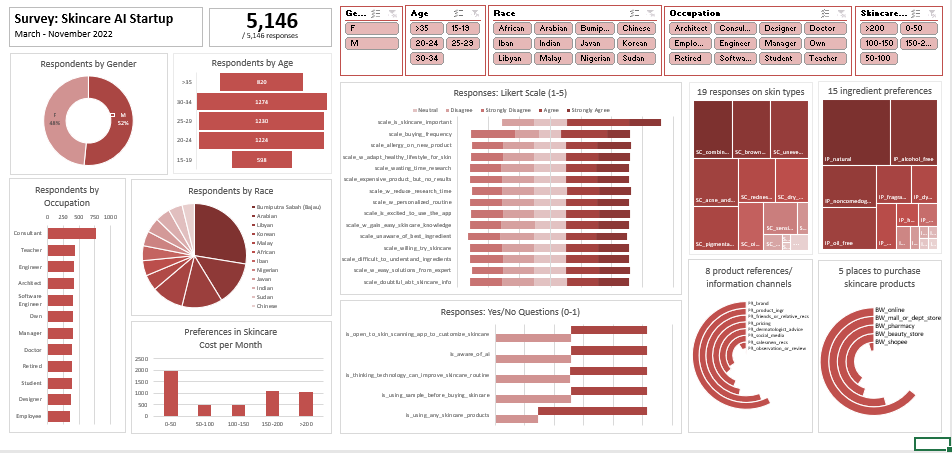
- Designed a dashboard in Excel from 5,000+ responses across Malaysia to check for brand awareness in AI skincare start-up, along with addressing pain points and preferences in buying skincare for market research
- Proposed data-driven recommendations on both product development and marketing for AI skincare start-up from visualized responses of 19 skin types, 15 ingredient preferences, 8 product channels, and 5 marketplaces
OLIST Dashboard: Customer Sales and Sellers Marketing Funnel
🔗Dataset Python: EDA-and-data-cleaning data-analysis | Tableau 🏷️ e-commerce real-world-data python tableau
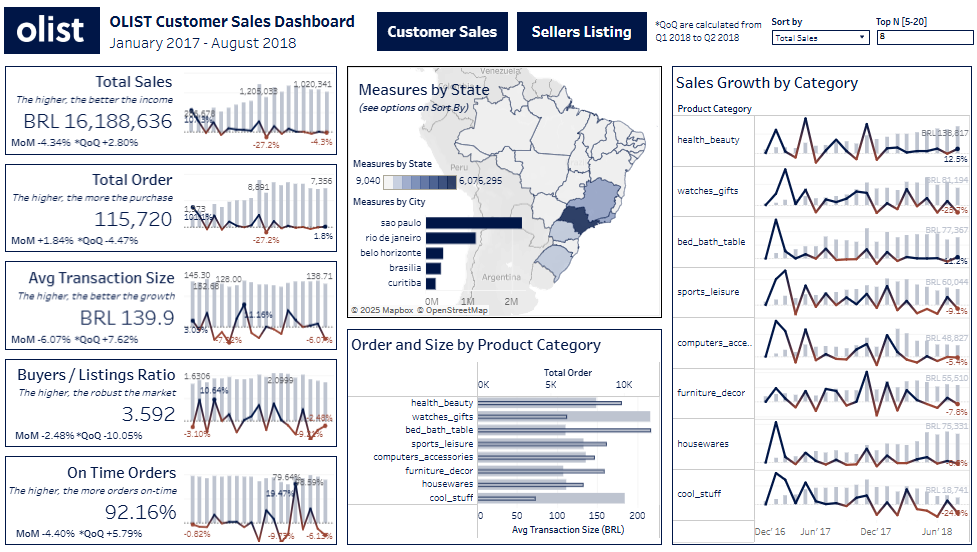
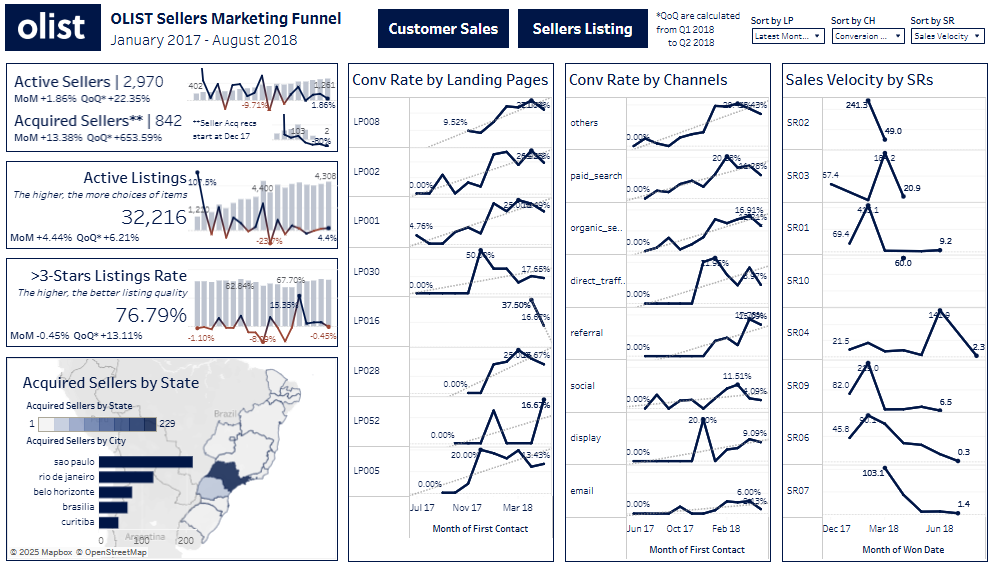
- Conducted data processing and cohort analysis from 10+ relational e-commerce datasets in customers sales and sellers marketing funnel with Python to uncover behavioral and sales insights
- Proceeded to built two different dashboards in Tableau aimed towards insights for user acquisition, featuring 9 KPIs with MoM and QoQ, demographics, sales growth by product categories, landing pages, acquisition channels, and sales representatives
Airline Loyalty Programs Dashboard
🔗Dataset Tableau 🏷️subscription airline-data tableau
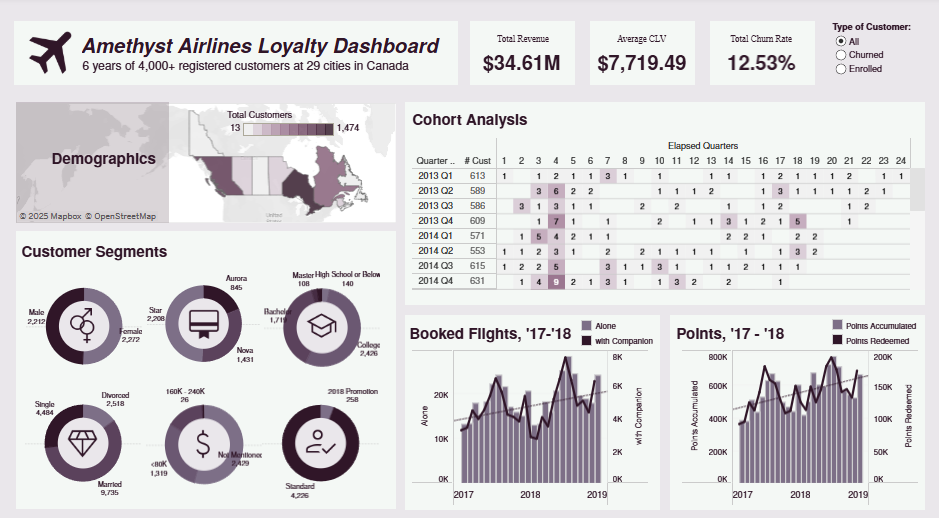
- Developed a dashboard in Tableau from a 6-year loyalty history and flight activity data of a fictitious airline in Canada to display segments and behavior in 4,000 registered customers
- Assembled visuals of customer segmentation by six variables, demographics, quarterly cohort analysis, booked flights and points, and scorecards for metrics of revenue, CLV, and churn rate
E-Commerce Sales Dashboard, Ruby Goods
🔗Excel 🏷️sales e-commerce excel
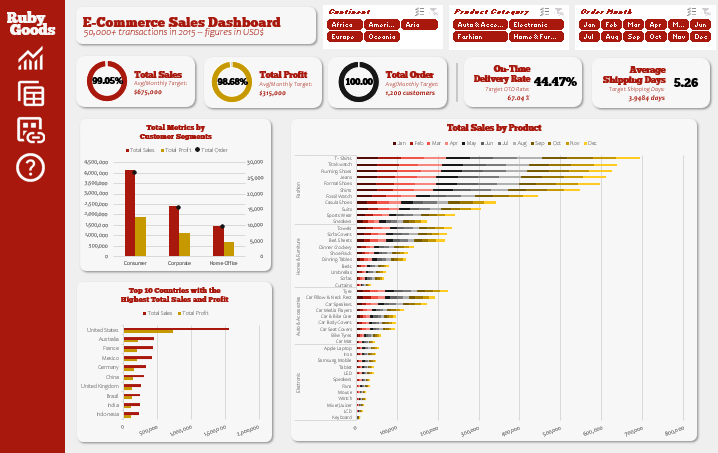
- Transformed 40,000+ e-commerce sales in four product categories into a dashboard in Excel tracking sales and shipping metrics
- Conducted data analysis through PivotTable, created three slicers to filter data further, and streamlined the layouts for a user-friendly dashboard
- Visualized total metrics by customer segments, top 10 countries with highest total sales and profit, and total sales by product
Inventory and Sales Dashboard: shop.arianagrande.com
🔗Dataset nbviewer 🏷️shopify inventory real-world-data power-bi
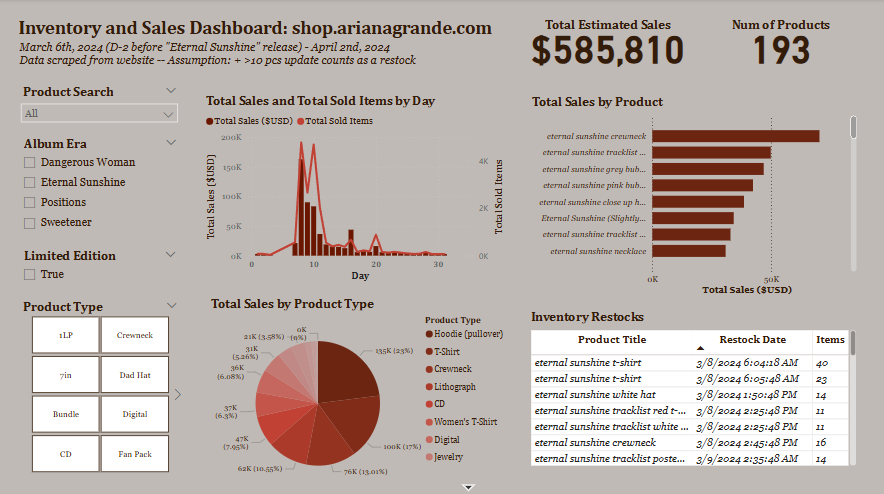
- Developed a dashboard in Power BI from 800K+ real-time data to track inventory changes of a singer’s merch shop from Shopify after the latest album release
- Calculated metrics of total estimated sales and number of products, along with creating filters of product search, album era, product type
- Visualized total sales and sold items by day, total sales by product and product type, and histories of inventory restocks
DataCo Supply Chain Dashboard
🔗Tableau 🏷️e-commerce supply-chain big-data tableau
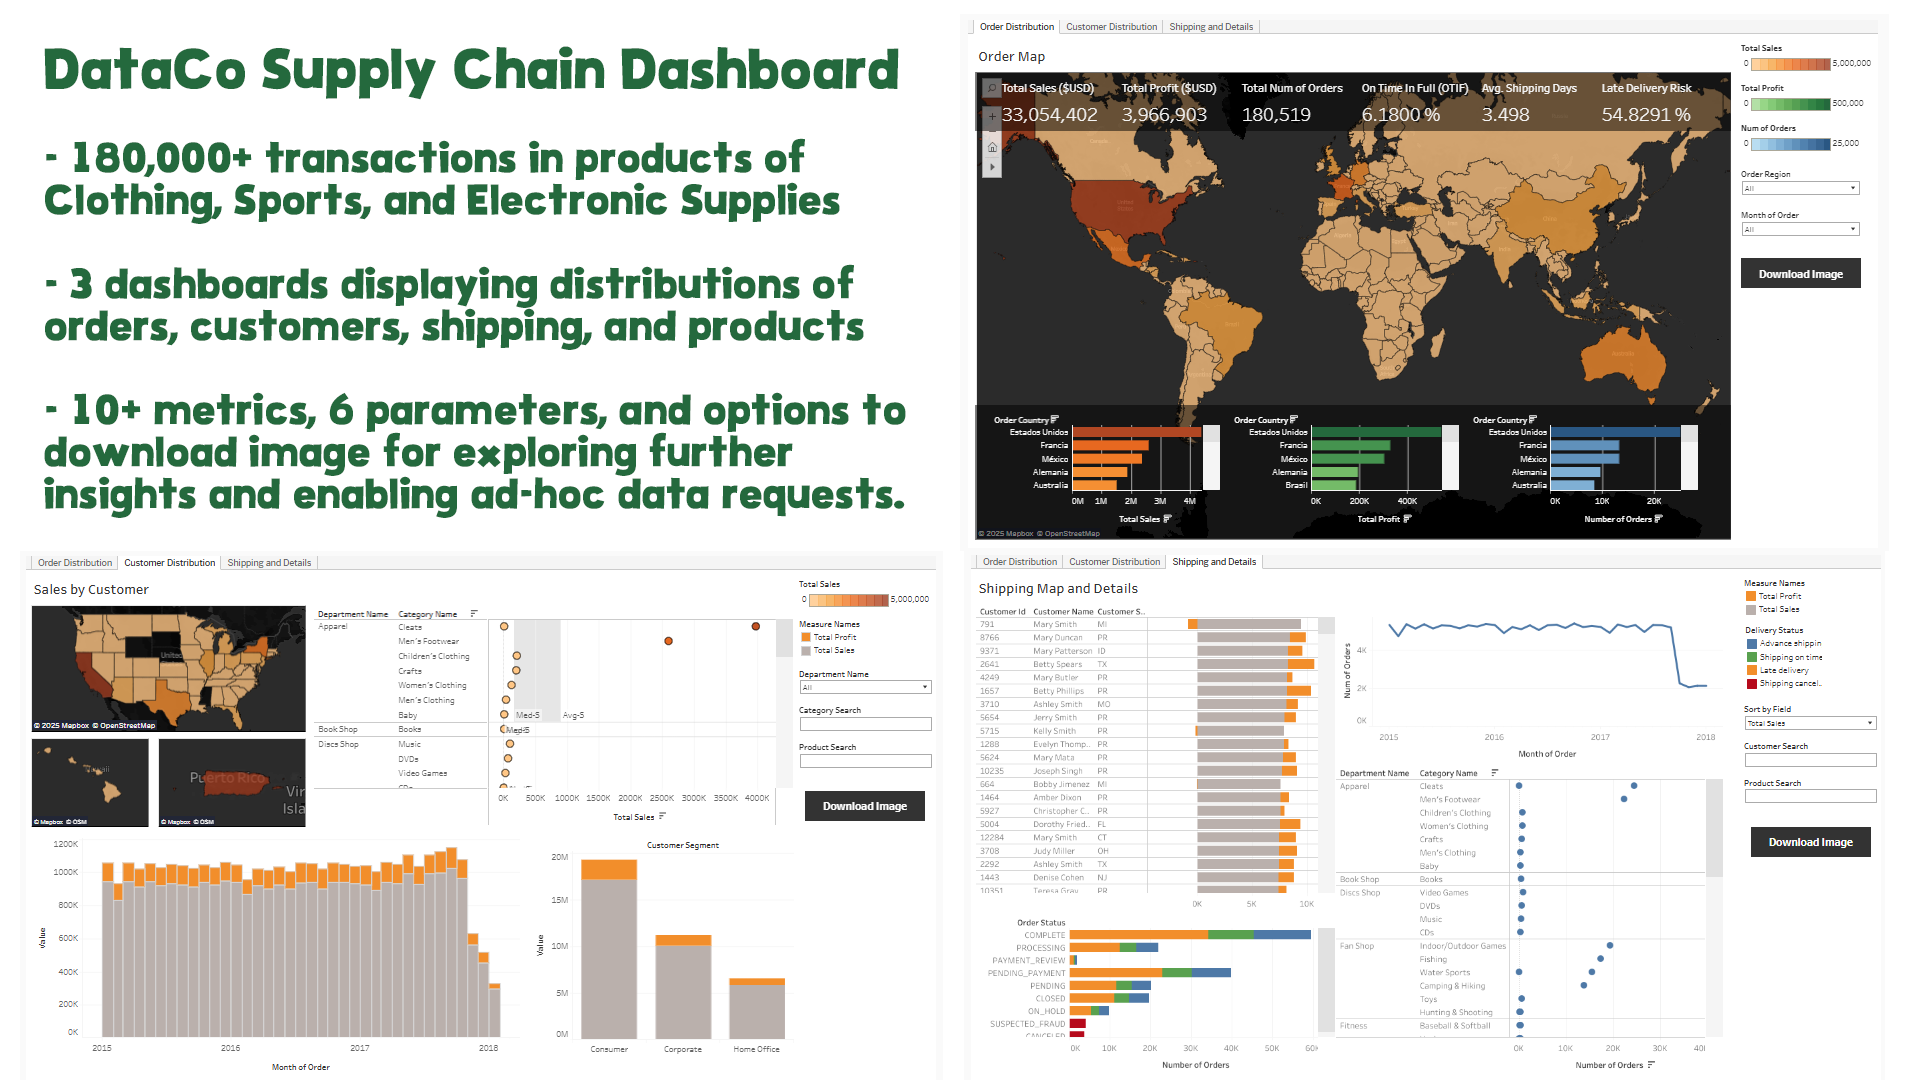
- Transformed 180,000+ transactions in a supply chain of clothing, sports, and electronic supplies, into three dashboards visualizing distributions of orders, customers, shipping, and products.
- Added total sales and profit by month, filter of order map by regions, and transaction details, with 10+ metrics and 6 parameters to explore insights further and enable ad-hoc data requests.
Dashboard of Pharma Sales: Kimia Farma, Indonesia
🔗Looker 🏷️dashboarding pharma looker
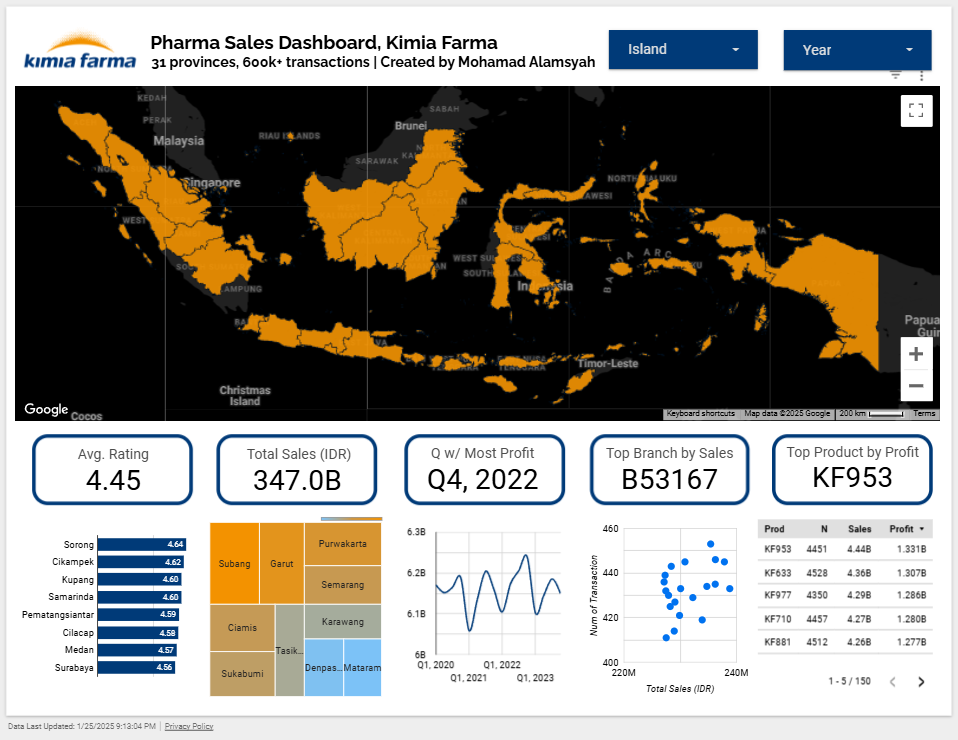
- Developed a dashboard in Looker Studio for drug sales of a pharmacy retail company using a 4-year period dataset of 600,000+ anonymized transactions in 1,762 branches across Indonesia
- Displayed 5 metrics aimed towards cross-functional stakeholders such as average ratings, total sales, and top product by profit, along with filters on year period, city, provinces, and main islands
SportsLogs: Sports Logging Web App Dashboard
🔗 nbviewer Github Streamlit 🏷️data-visualization dashboarding web-development sport Python Streamlit
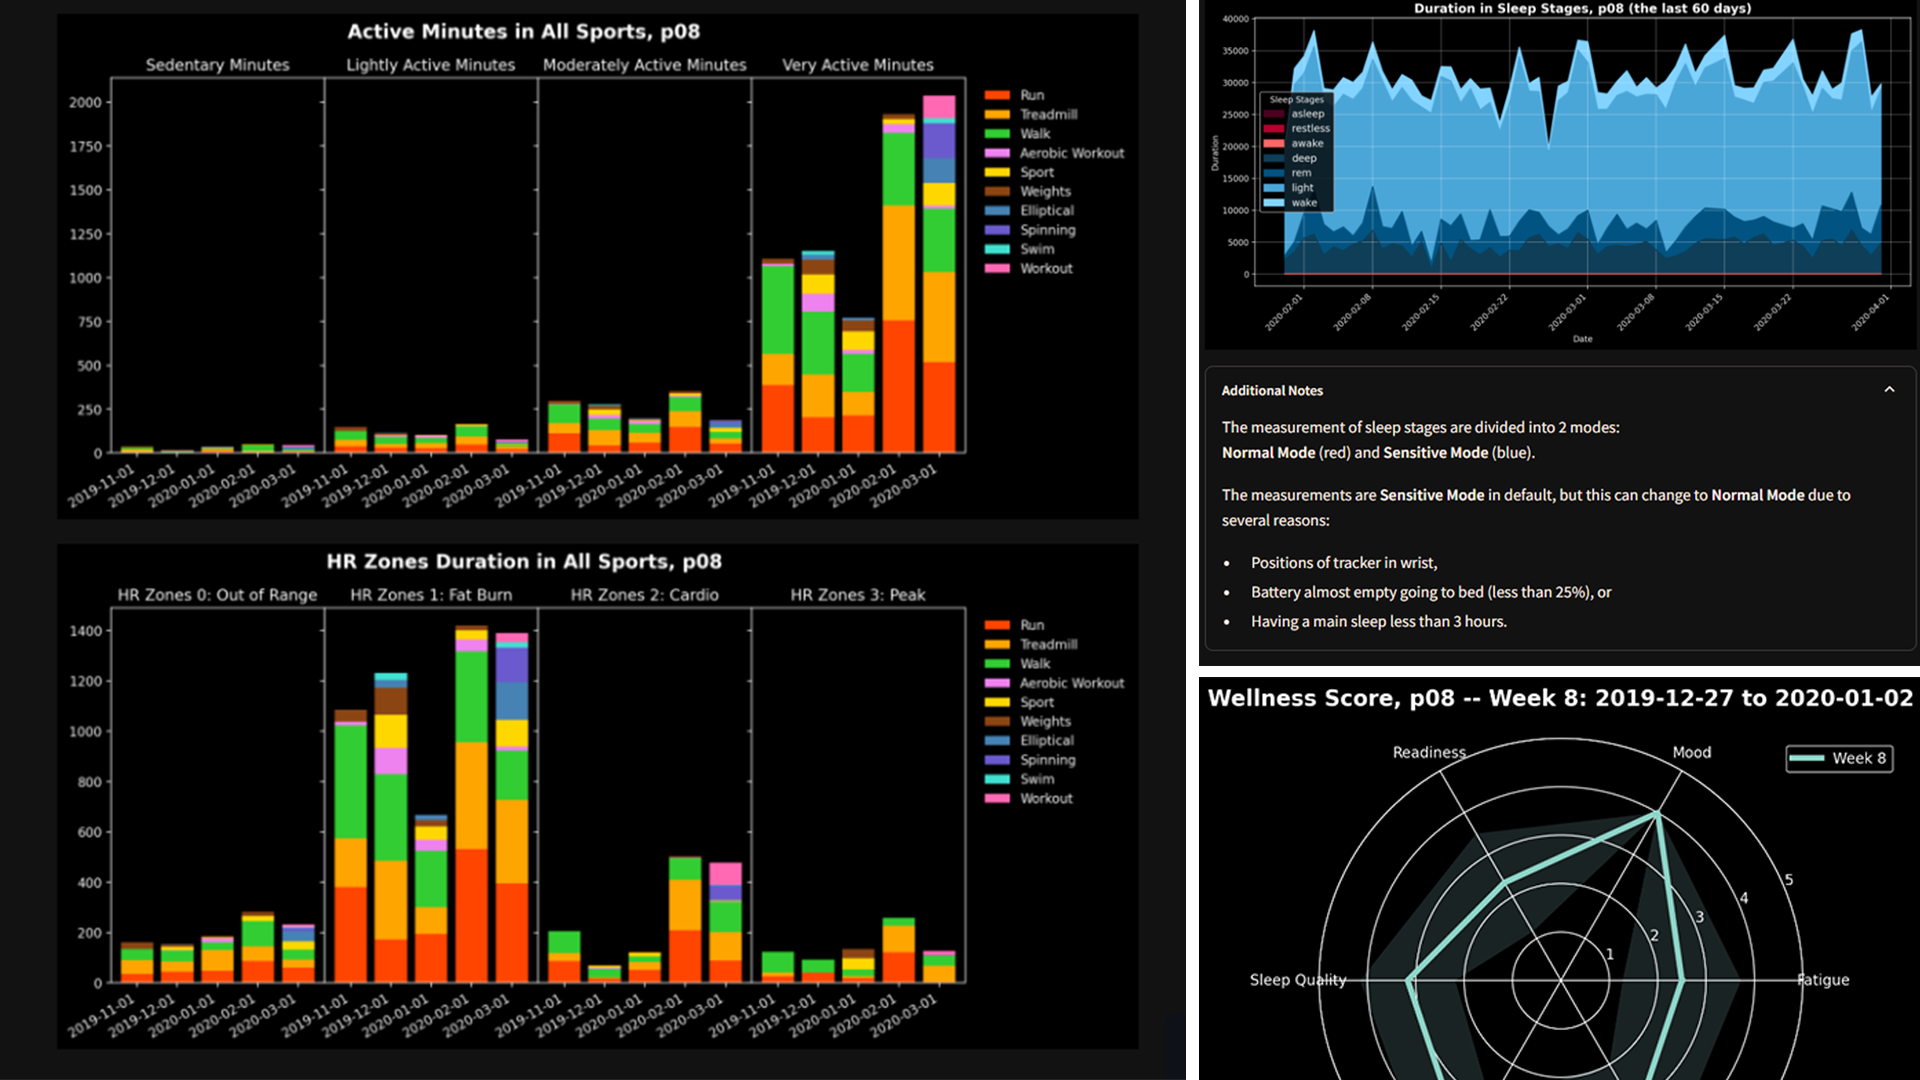
- Processed 10+ datasets (mainly in JSON format) from biometrics sensor of FitBit, and developed a web-app dashboard with matplotlib and Streamlit in Python to track performance of 16 athletes across 5 months
- Created a total of 24 functions for data cleaning and data visualization in both by individual and by team, showcasing physiological metrics such as sleep stages, active minutes, HR zones, and SRPE by sport activities
Alam’s Productivity Tracker
🔗Looker 🏷️dashboarding personal-project looker
![]()
- Conducted 2+ years worth of data entry in productivity metrics such as Pomodoro sessions, task chunks, and notable milestones from progress archive in a study-streaming platform
- Transformed the data into a dashboard with Google Sheet and Google Looker Studio with charts such as cumulative progress by chunks and read books sorted by recent date.
YouTube Metrics Web App Dashboard
🔗Github Streamlit 🏷️data-visualization dashboarding web-development marketing business YouTube Python Streamlit
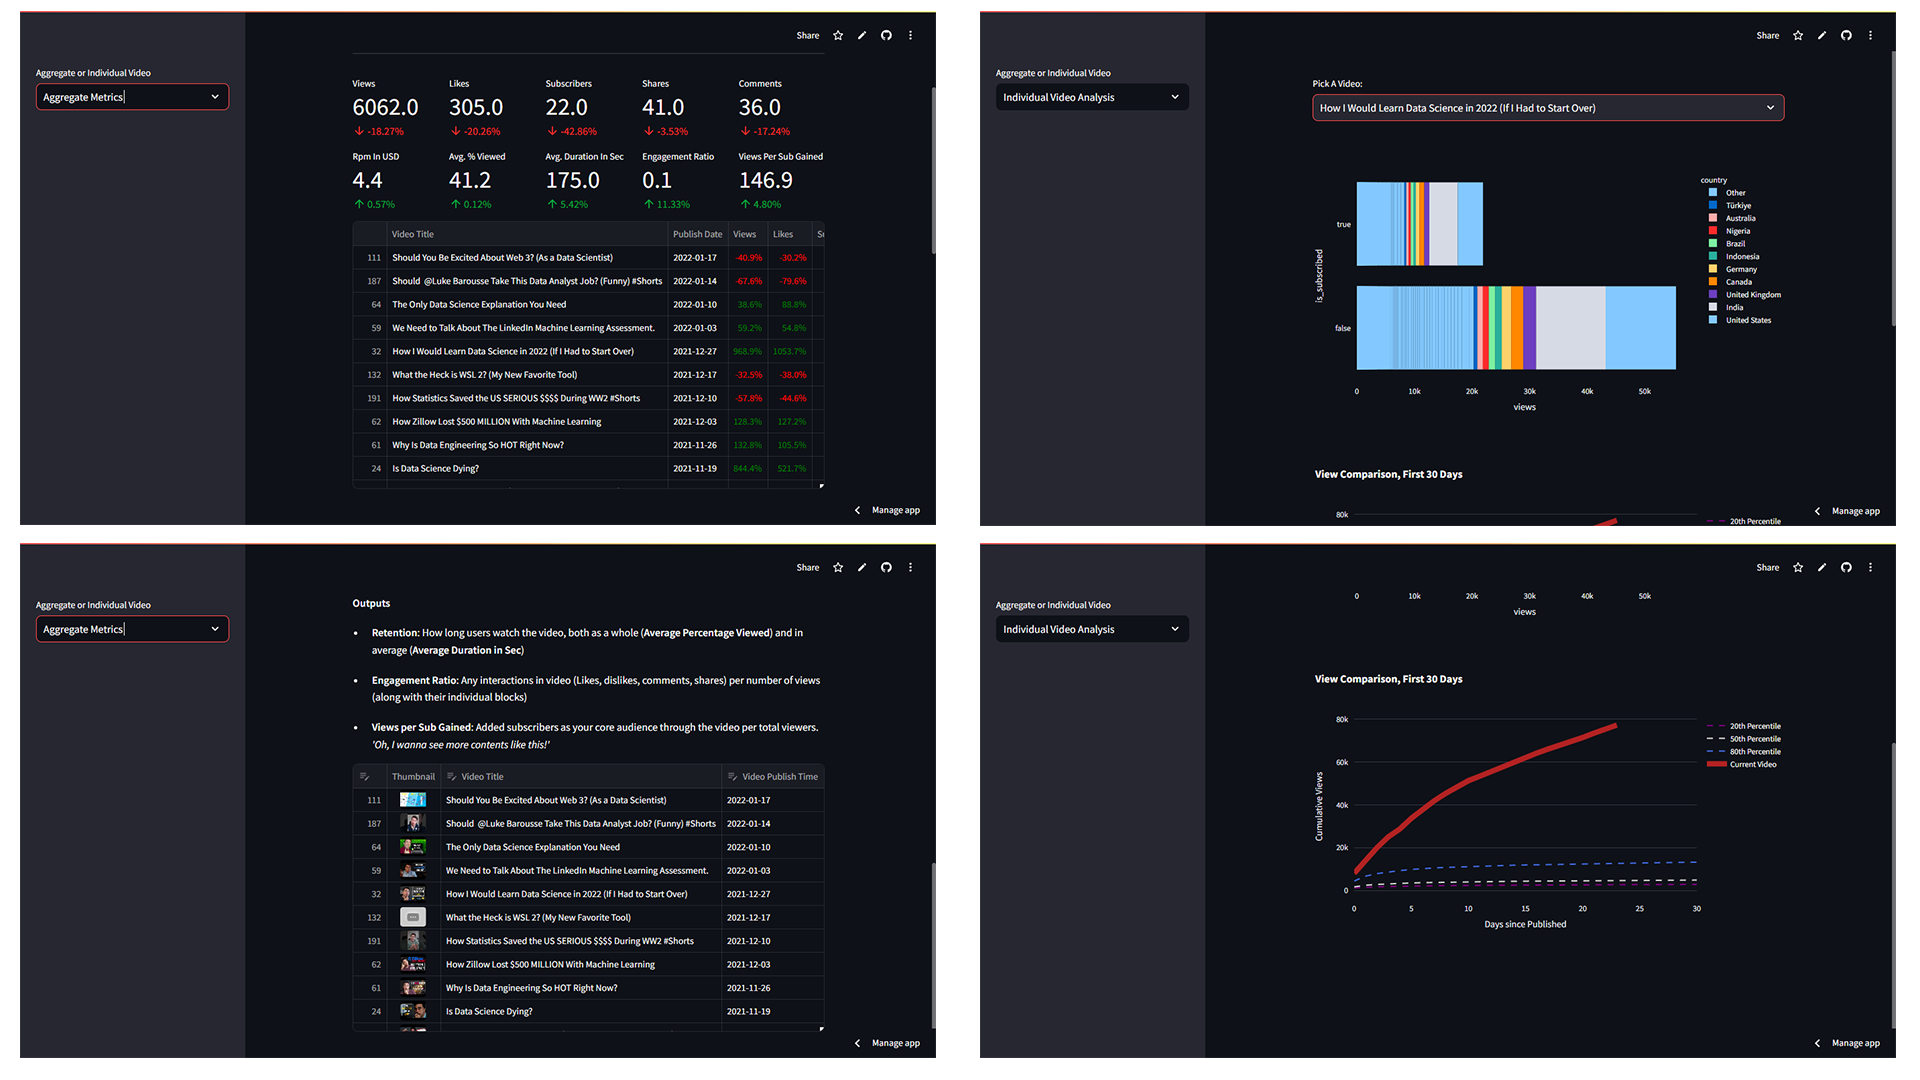
- Transformed relational datasets of performance in forms of video engagement and conversion, comments, and 2-year real-time daily statistics across 200+ YouTube videos, into a web app with Plotly and Streamlit in Python
- Created two features: Aggregate Metrics, displaying 10 KPIs with YoY growth in engagement and performance, and Individual Video Analysis, showing views distribution by countries, along with views 30 days after published
Data Platform for Automation in Drug Clearance Letter Generation
🔗📽️Loom 🏷️data-platform automation google-sheets google-app-script
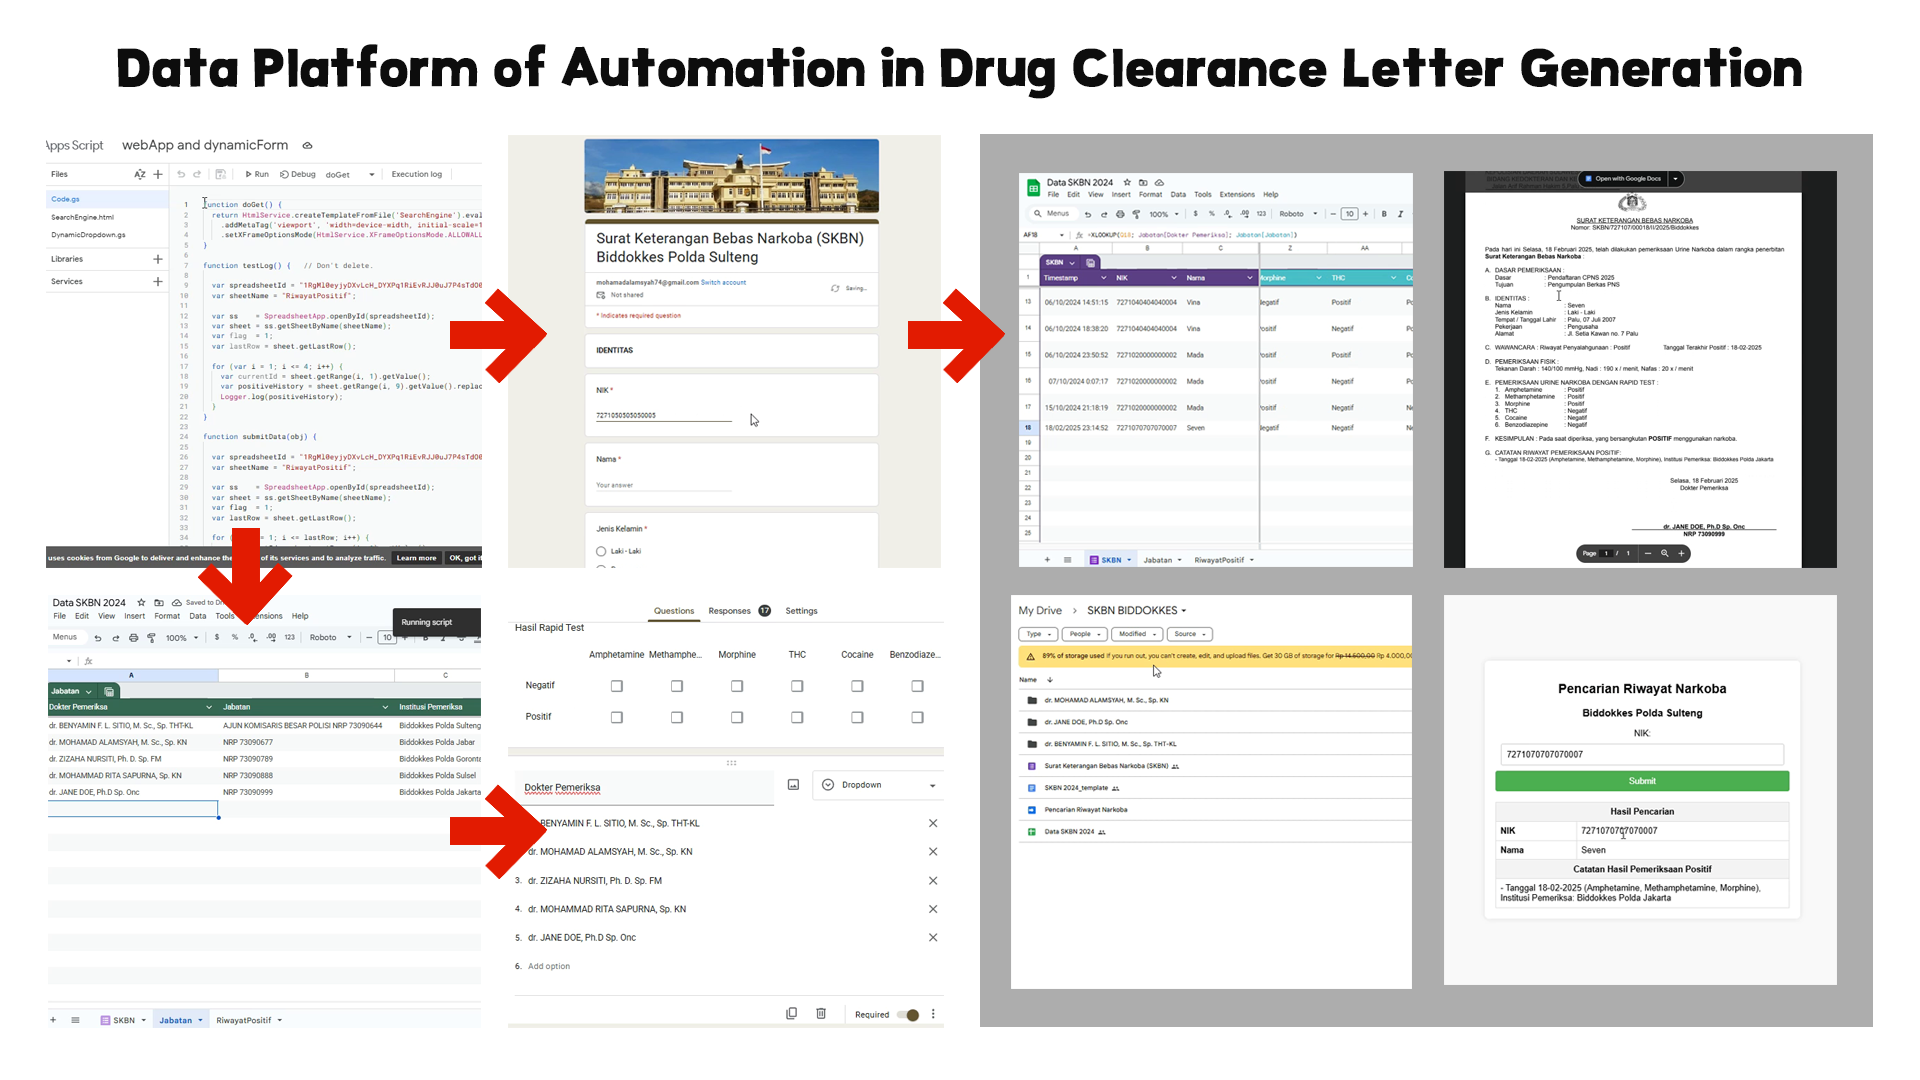
- Developing a data platform in generating a drug clearance letter, with inputs of drug test results in Google Forms and outputs for both patients and medical providers in Central Sulawesi, Indonesia
- Featuring Google Sheets for data processing towards final outputs, Google Docs for letter generation, Google App Scripts for search engine by National ID and dynamic markdown in Google Forms, and Google Drive for data storage grouped per medical provider
Research Payments of Non-Covered Recipient Entity (NCRE) in the United States 2023
🔗Dataset Github | nbviewer: 01-data-cleaning 02-data-analysis-bigquery | Tableau: 03-research-payments-NCRE-2023 🏷️healthcare RnD CMS real-world-data BigQuery Python Tableau
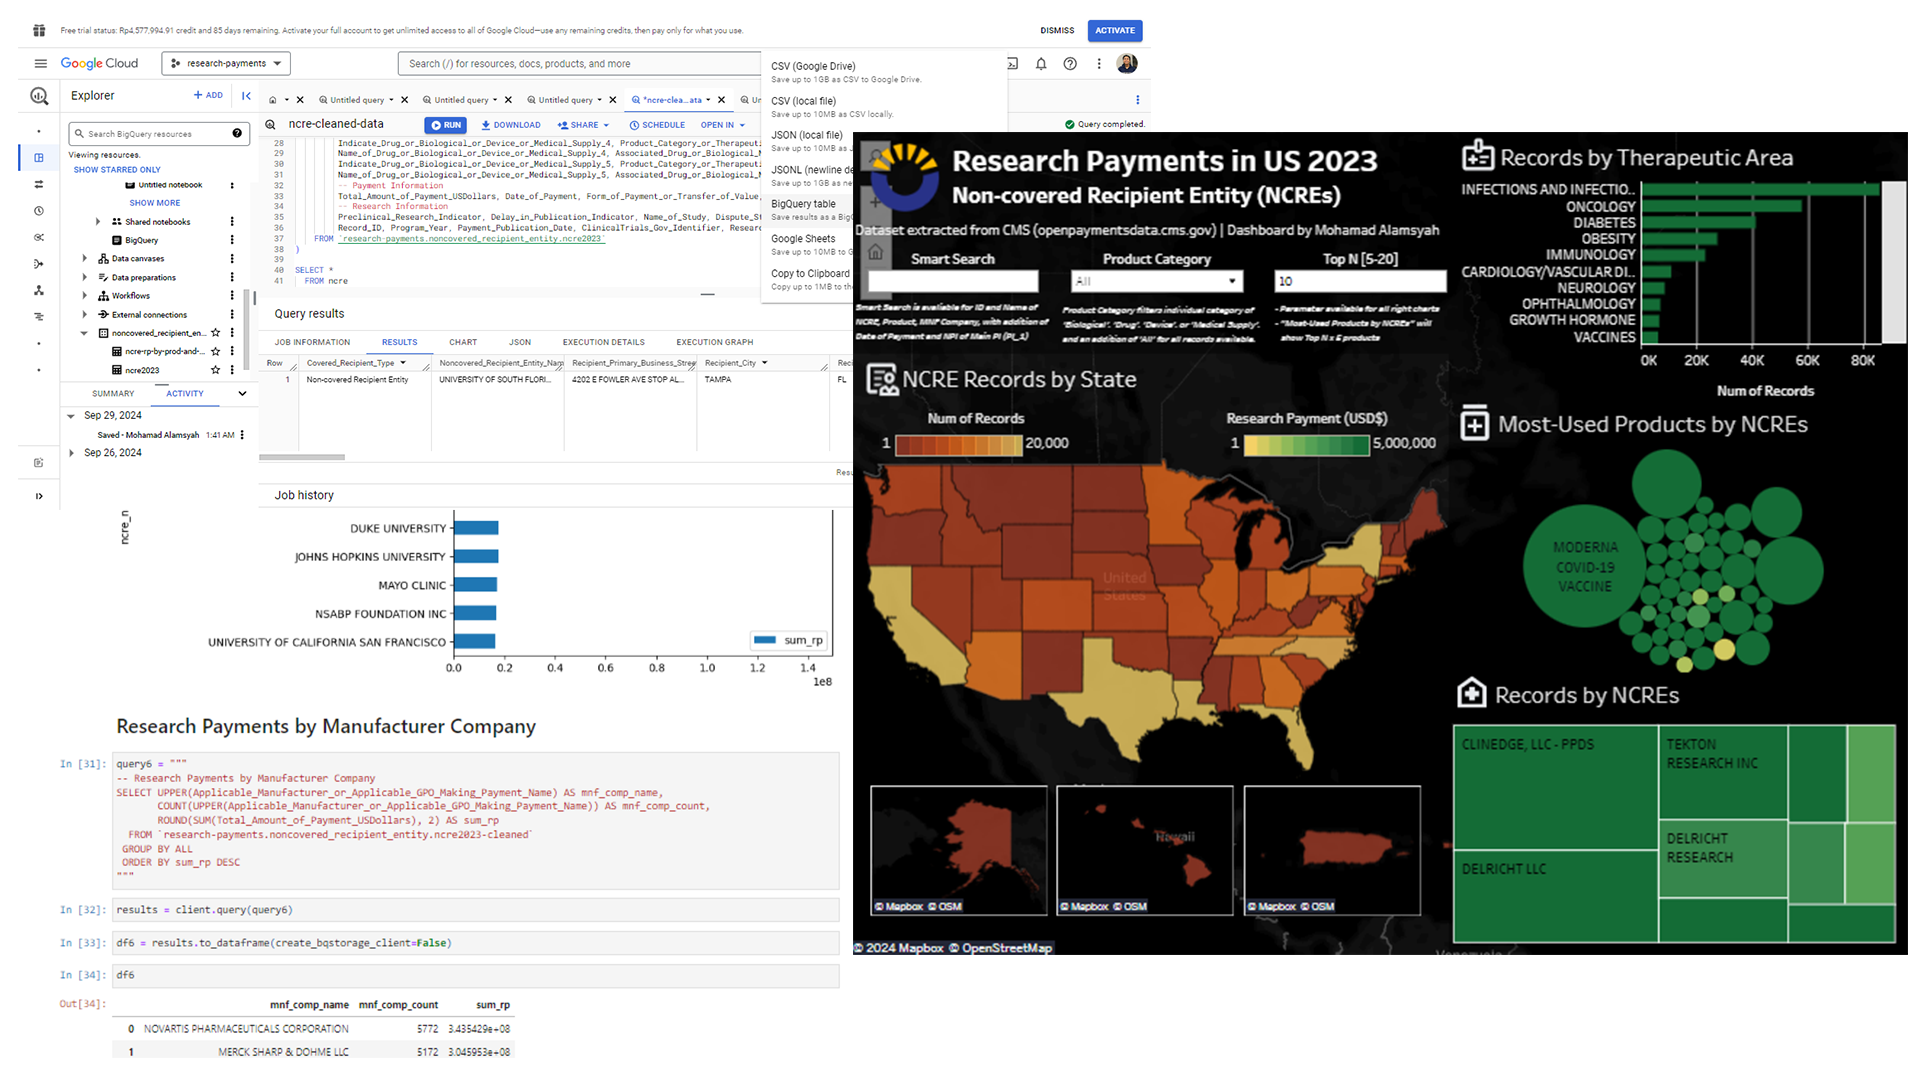
- Visualized a map-based dashboard of research payments from ~400,000 records in CMS OpenPayments of non-teaching hospital institutions (NCREs) in the US with Tableau integrated with GCP
- Showcased insights by data analysis in SQL (BigQuery) such as total records in research by state and city, and most-funded research by therapeutic areas, products, manufacturing companies, and NCREs or institutions
Product Segmentation and Customer Classification in an Online Retail Company
🔗Dataset nbviewer 🏷️clustering k-means wordcloud pca machine-learning marketing-data-science
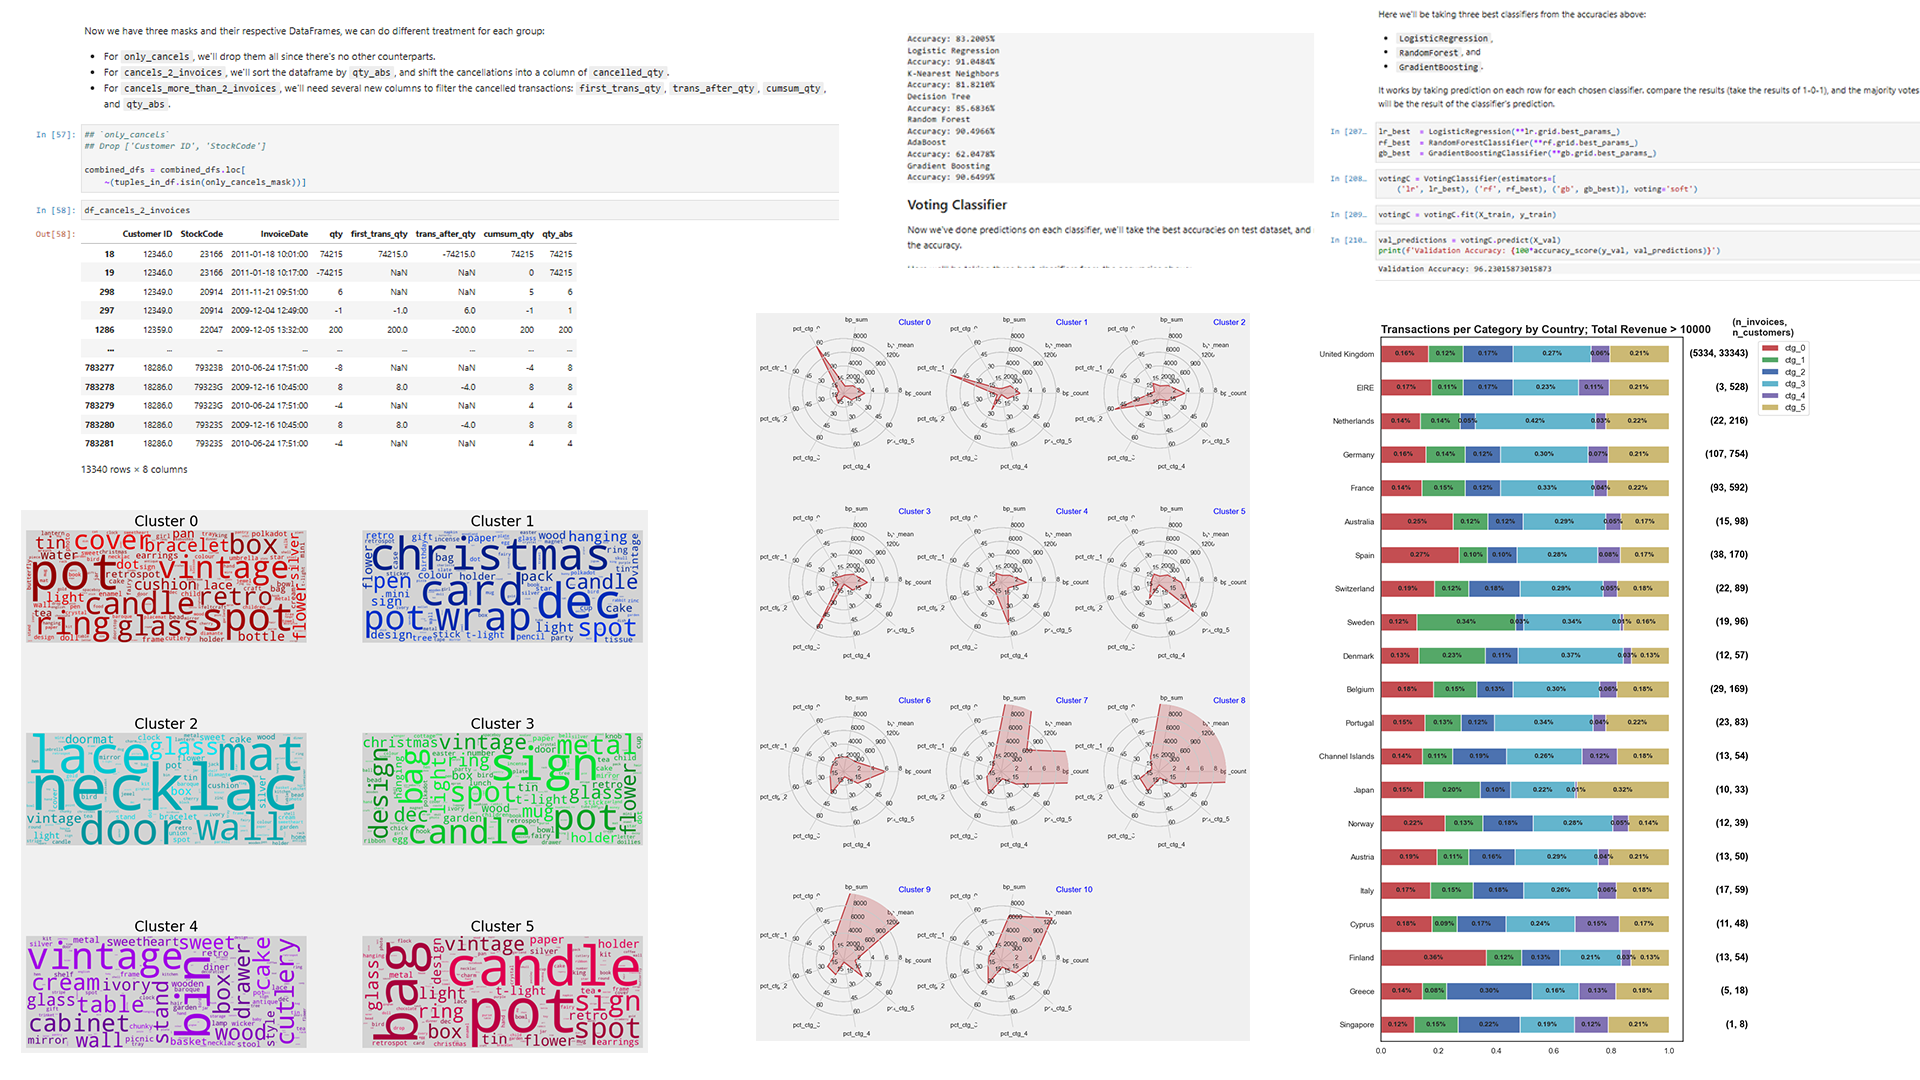
- Transformed 1,000,000+ online retail transactions in UK from 40+ countries into 6 categories of products and 11 profiles of customers with Python to identify patterns and craft strategies for sales and marketing teams
- Creating a predictive model by clustering data with evaluation methods to define optimal number of groups with best similarities, and explored 9 ML algorithms resulting in a model accuracy of 91.5389%
A/B Testing: Commitment Check for Online Students in Udacity ✏️📈🔎
🔗nbviewer 🏷️a/b-testing data-analysis Python
- Created an experiment design towards a change in the website after clicking “Start Free Trial” at Udacity to filter out frustrated students while retaining paid users
- Conducted experiment analysis towards the data and chosen metrics of gross conversion and net conversion with statistical methods of sanity checks, practical and statistical significance check, sign tests, and proposed recommendations and suggestions from the insights
Drug Reviews on drugs.com: Dashboard and Sentiment Prediction 💊📊⚙️
🔗 Dataset Github | Tableau (updated with BigQuery) | nbviewer:
01-EDA-and-data-cleaning 02-import-csv-to-postgresql 03-dashboard-of-drug-reviews 04-sentiment-prediction » New Link (Old Link had error) 🏷️big-data data-cleaning Python PostgreSQL BigQuery Tableau natural-language-processing
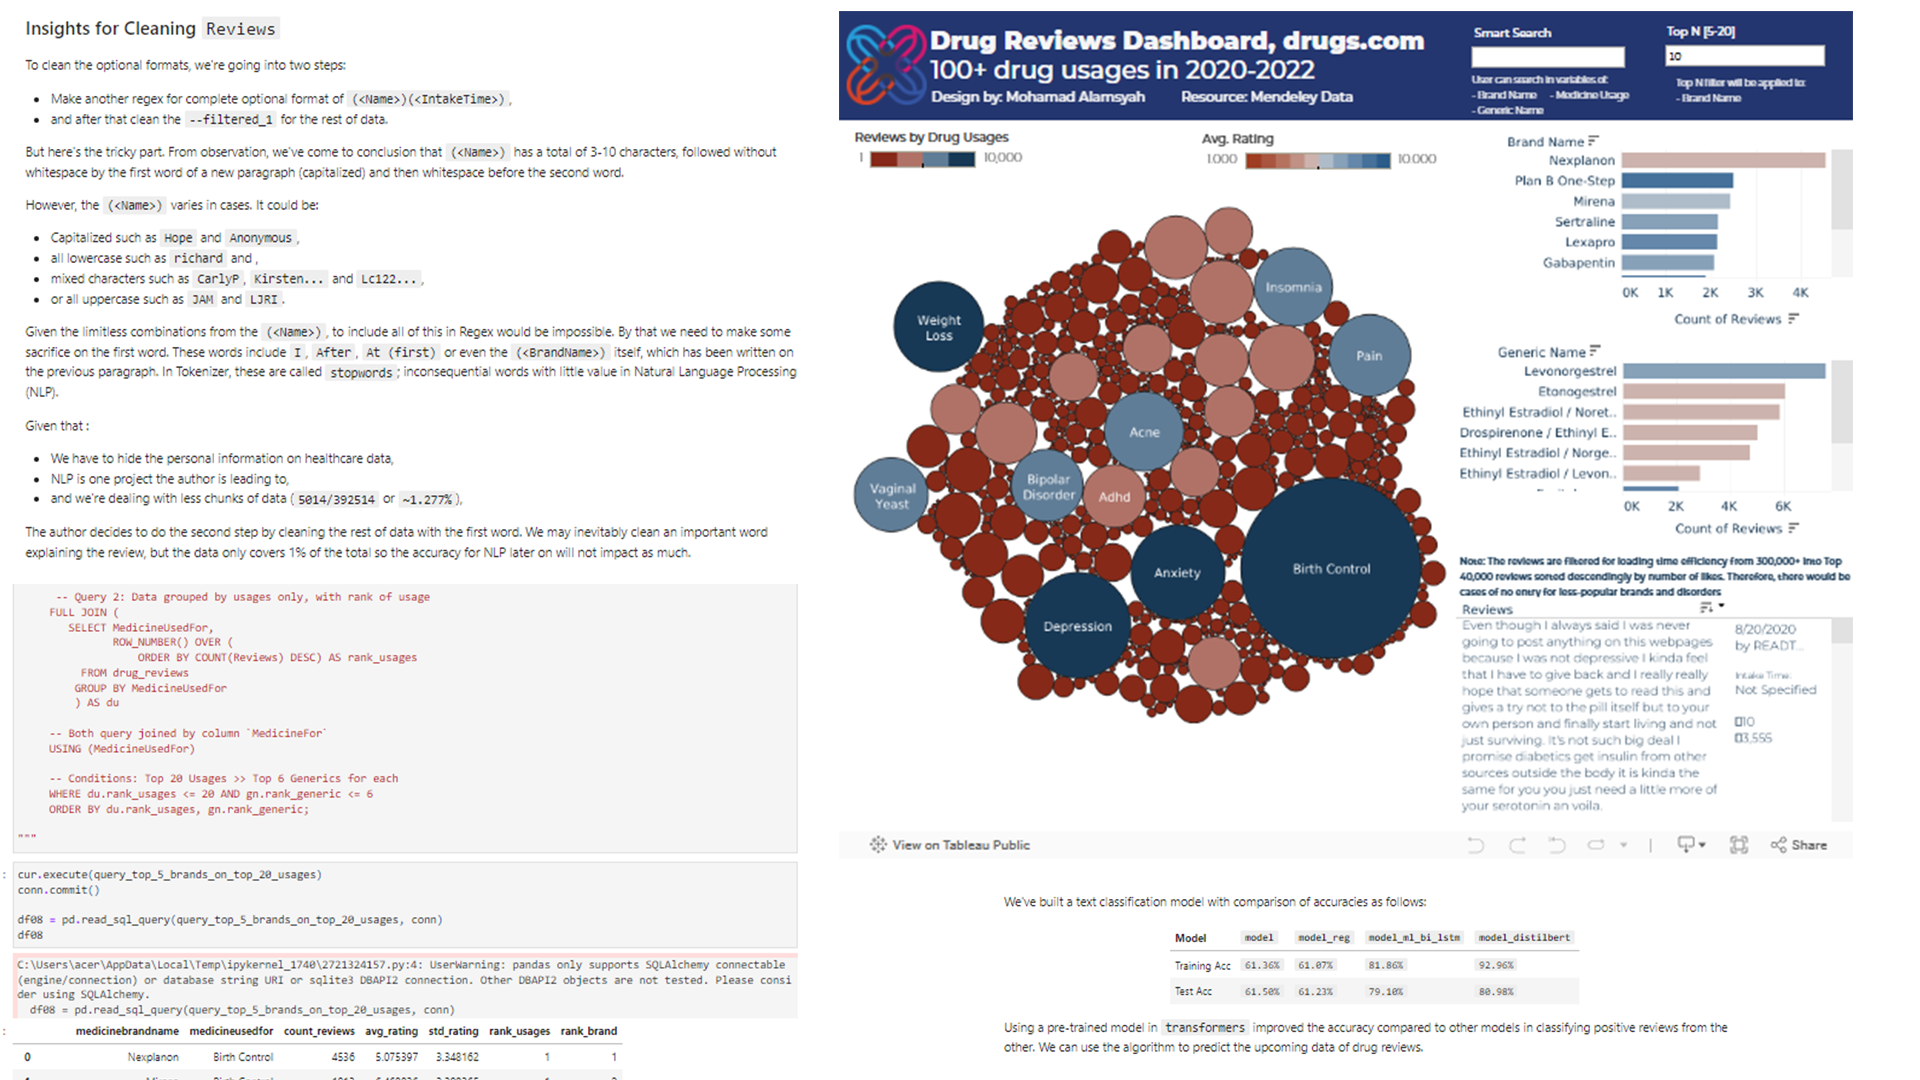
- Developed drug brands ratings dashboard in Tableau from 390,000+ records in drugs.com, conducted data analysis in PostgreSQL, and modeled sentiment prediction from reviews in Python with accuracy of 80.98 %
- Conducted large-scale data cleaning of drug reviews, implementing HIPAA-compliant workflows to protect patient privacy, and streamlined drug names into three new columns of drug brands, usages, and generic names
Revenue Prediction via Customer Lifetime Values (CLV)
🔗Github | nbviewer: 01-EDA-and-data-cleaning 02-data-visualization 03-feature-engineering 04-revenue-prediction 🏷️big-data time-series-data forecasting machine-learning
This project predicts revenue via customer lifetime values such as RFM, total quantity, and time-related variables on a dataset of Online Retail in UK. The variables are extracted into 8 periods (each new period is made for every 2 months): 6-month window of data for features and the next 2-months of total revenue per customer as labels.
COVID-19 Spread in the United States 🗺️
🔗Tableau Public 🏷️data-analyst data-visualization dashboard
This project visualizes the spread of COVID-19 in the US daily in 2020-2023 from a dataset shared by Opportunity Insights Economic Tracker, with data sourced from New York Times (NYT), Centers for Disease Control and Prevention (CDC), and John Hopkins University (JHU). The dashboard consists of:
- top N (adjustable, 1-10) states with highest new cases of COVID-19 on a chosen day,
- options to look for a specific state by clicking on the state map,
- recent and current statistics of death, vaccination, and COVID-19 cases.
Analyzing COVID RNA Sequences 🧬🧪
🔗nbviewer 🏷️biopython bioinformatics
This project looks at COVID RNA sequences consists of reference first sample in Wuhan, China, Asia and also the first sample in North America, and two of emerging mutant variants on the period of time: Delta and Omicron. The project shows how to download and parse the target sequences, align them to find similarities towards the reference, and then applying alignments to find mismatches in the base sequences.
Predicting Hepatitis C 🧪🩺🌟
🔗nbviewer 🏷️machine-learning healthcare-data
This project predicts patients of Hepatitis C based on a dataset of laboratory blood test using nine models of machine learning: RandomForest(), Support Vector Machine SVC(), up to GradientBoosting() and VotingClassifier()
Predicting MVPs in NBA Seasons 🏀🏆🌟
🔗GitHub | nbviewer: 1-web_scraping 2-data_cleaning 3-mvp_predictions 🏷️web-scraping machine-learning real-world-data
This project predicts MVP in NBA seasons in 2020 to 2023 through three steps: collecting the data via web scraping in the website, data cleaning for training model purposes, and MVP predictions using three models of machine learning: Ridge(), RandomForest(), and GradientBoosting().
Detecting Pneumonia in X-Ray Images 🫁🩻
🔗nbviewer 🏷️deep-learning transfer-learning biomedical-image-processing
This project detect patients with pneumonia through a dataset of patients’ X-Ray images by utilizing Deep Learning, specifically convolutional neural network CNN and Transfer Learning of ResNet50V2.
Classifying Real and Fake Disaster Tweets 🔎📲
🔗GitHub 🏷️deep-learning natural-language-processing
This project classifies real and fake disaster tweets through natural language processing. Besides word visualization on both kinds, the models used include shallow and deep neural networks, and also transformer model of distilcase-bert-uncased.
Time-Series Trade Forecasting ⌚📈
🔗nbviewer 🏷️deep-learning sequence-models
This project forecasts future trades of stocks in Yahoo! Stock Price using deep learning models: Recurrent Neural Network RNN(), Long-Short Term Memory LSTM(), convolutional layer Conv1D(), and also hyerparameter tuning to optimize the model’s accuracy in forecasting.
Predicting Listing Gains of the Indian IPO Market 💰🪽
🔗nbviewer 🏷️deep-learning neural-network
This project predicts companies that has listing gains across the Indian IPO market from a dataset of moneycontrol consisting of company names with its issues size and price and subscriptions from several entities. It begins from data exploration and visualization, treatment of outliers, and defining the classification model with deep neural network.
Classifying Heart Disease 📂🫀
🔗nbviewer 🏷️machine-learning logistic-regression
This project classifies a patient of heart disease through several features by using LogisticRegression(). The dataset is from the UCI Machine Learning Repository which includes several medical characteristics on each patient, including resting blood pressure, fasting blood sugar, up to ST depression induced by exercise and number of major vessels colored by spectroscopy.
Optimizing Model Prediction ⚙️📈
🔗nbviewer 🏷️ machine-learning forward-selection backward-selection
This project compares several models on LinearRegression() that include: SequentialFeatureSelector of Forward Selection and Backward Selection, RidgeCV, and LassoCV. The dataset used consists of feature that results in area of damage in a forest. We’re using wind (Wind speed) and temp (Temperature) as columns for reference model, all column the numerical values for regularized models of RidgeCV and LassoCV, and we’ll cherrypick the best 2-6 features on forward and backward selection accordingly.
Predicting Employee Productivity 🧑🏭💹
🔗nbviewer 🏷️machine-learning random-forest
This project predicts productivity of garment factory employees using a model of DecisionTreeClassifier() and RandomForestClassifier() to get the strongest predictors. The dataset is from the UCI Machine Learning Repository which includes several aspects from day, team number, up to standard minute value for a task and incentive. This could give insights to managers regarding aspects that can influence actual productivity compared to the target, from time spent for a garment, up to incentives and over-working time.
Predicting Heart Disease 🔮🫀
🔗nbviewer 🏷️machine-learning k-nearest-neighbors
This project predicts a patient of getting a heart disease from several features by using k-Nearest Neighbors (k-NN) or KNeighborsClassifier(). The dataset includes relevant information for each patient, from their personal information up to relevant medical data.