Alam
🧑💻Data Science Portfolio by Mohamad Alamsyah
Tableau | GitHub | LinkedIn
Hello!👋 I’m Alam, a biomedical engineering fresh graduate from Indonesia 🇮🇩 I’ve been creating projects in healthcare, business, and more along the journey–all of which are compiled here. Thanks for checking in, and hope you enjoy!
Hospital Inpatient Discharges New York, 2020-2023
🔗Tableau 🏷️data-analysis dashboarding hospital Tableau
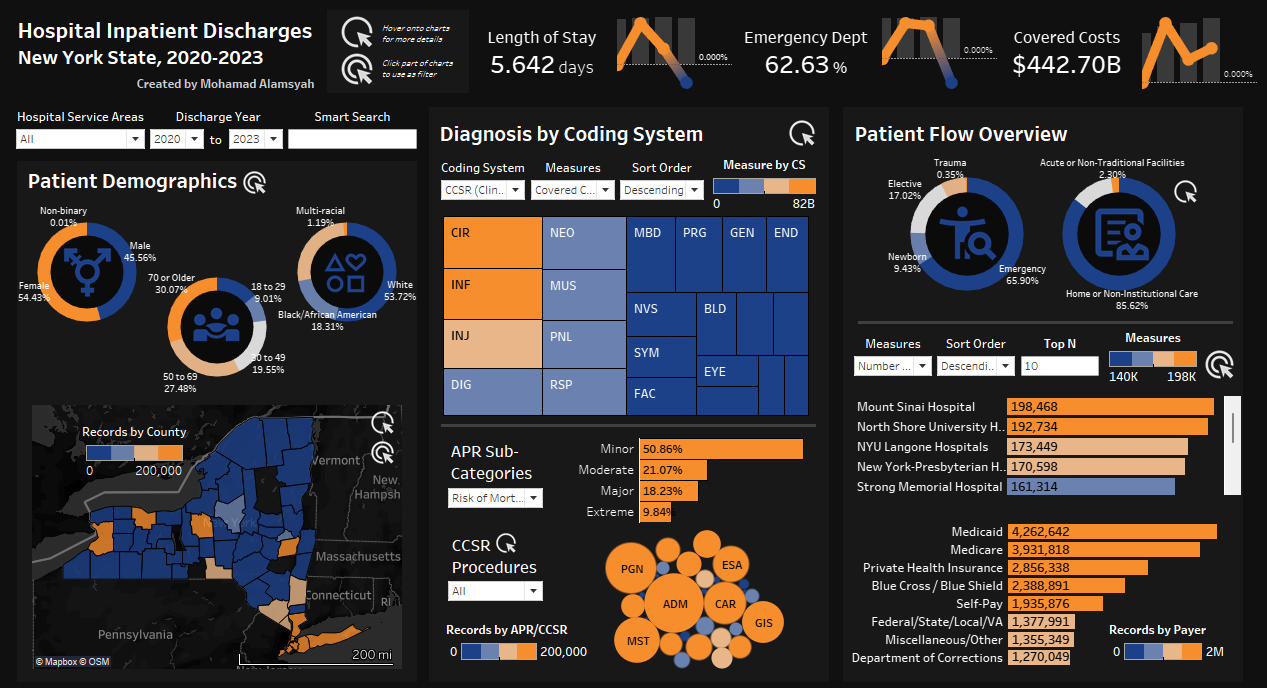
In this project I’ve designed a dashboard from de-identified hospital inpatient discharges in New York from 2020 to 2023. The dashboard calculates three metrics in healthcare quality: Length of Stay, Emergency Department, and Covered Costs, with featuring patient demographics, diagnosis by coding system, and patient flow overview.
Influencer Marketing Campaign Dashboard
🔗Report 🏷️data-analysis marketing Excel PowerQuery
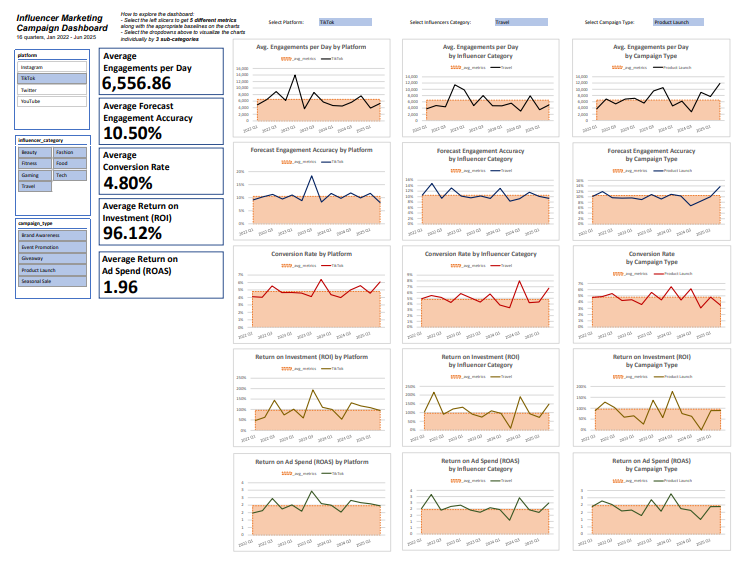
In this project I’ve developed a dashboard on influencer marketing campaign from January 2022 to June 2024 (dataset here). The dashboard visualizes 5 different KPIs: Avg. Engagements per Day, Avg. Forecast Engagement Accuracy, Avg. Conversion Rate, Avg. Return On Investments (ROI), and Avg. Return on Ad Spend (ROAS). The dashboard has features of visualizing each sub-categories individually, along with adding baselines for comparison with overall metrics, creating a simple, yet comparable and actionable insights.
Market Research: AI Startup in Skincare At Malaysia
🔗Python Report 🏷️data-analysis market-research excel PowerQuery
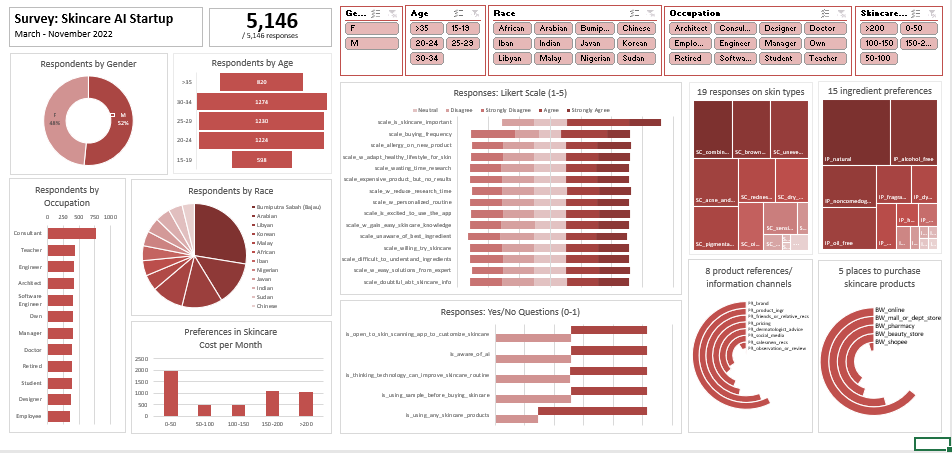
In this project I’ve created a dashboard for market research on AI skincare startup from 10000 Malaysian respondents (dataset here). The dashboard visualizes the demographics, responses in yes/no questions and Likert Scale, records on skin types, along with behavioral preferences in choosing skincare. The project comes along with a report for recommendations for the product and marketing team.
OLIST Dashboard: Customer Sales and Sellers Marketing Funnel
🔗Python: EDA-and-data-cleaning data-analysis | Tableau 🏷️ e-commerce real-world-data python tableau
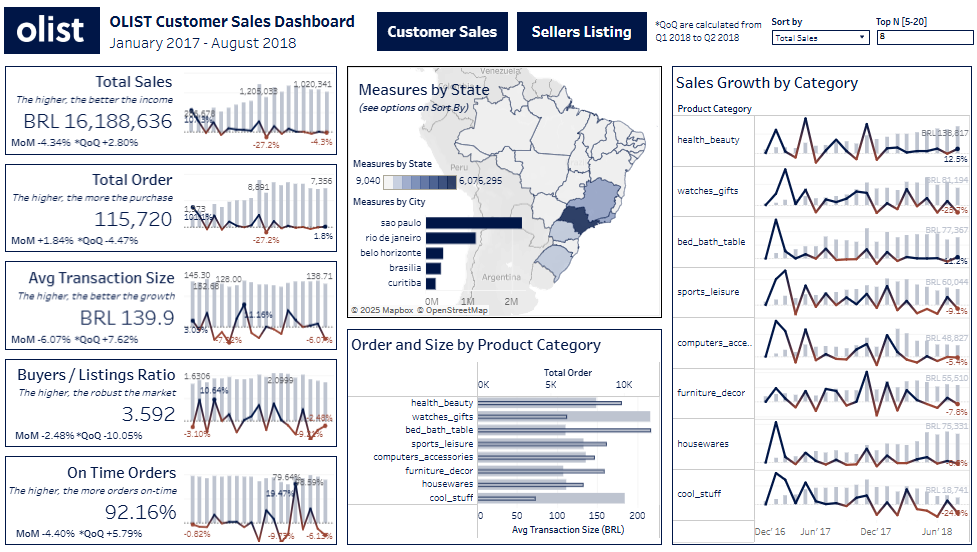
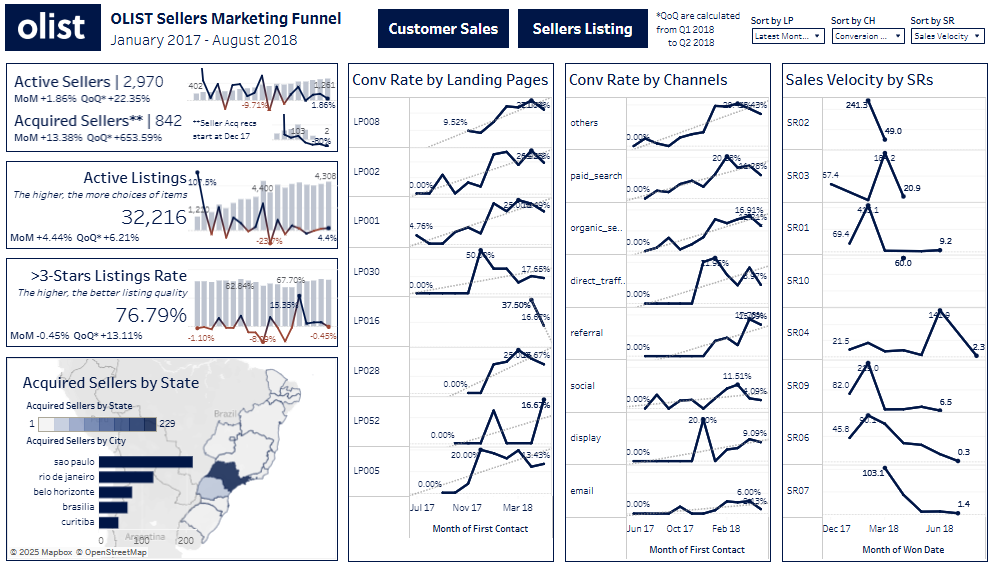
In this project I’ve conducted data cleaning and data analysis in an 1.5-year e-commerce data of OLIST Brazil with Python, and developed two dashboards in Tableau. In Python, the processes are aimed to define dashboard purposes, and the dashboard are developed with insights towards customer acquisition. The dashboard consists of 8 metrics with monthly values and MoM growth, metrics by demographics, sales growth by product categories, and performance of sellers marketing funnels such as landing pages, acquisition channels, and sales representatives.
Airline Loyalty Programs Dashboard
🔗Tableau 🏷️subscription airline-data tableau
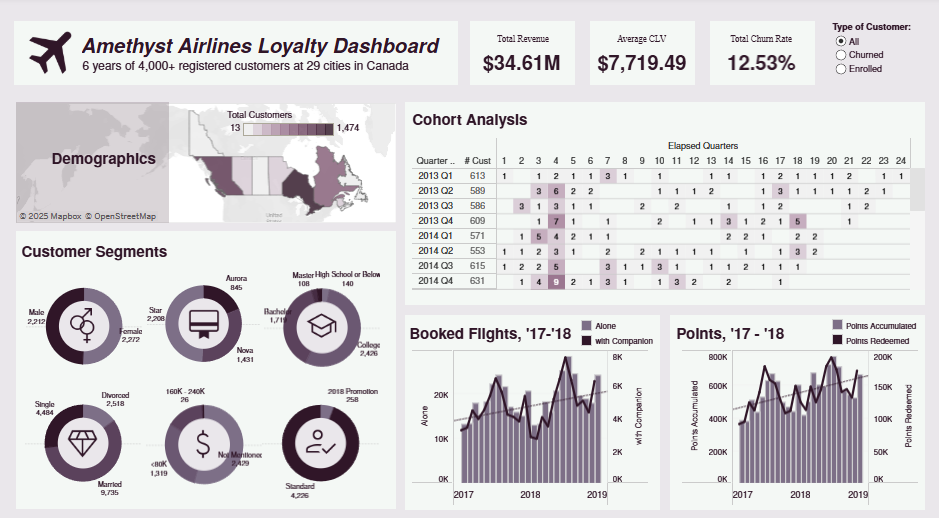
In this project I’m creating a dashboard of an airline loyalty programs spanning for 6 years with 10,000+ total customers across 29 cities in Canada. The dashboard displays explorative features for extracting insights such as demographics, customer segments, cohort analysis, along with flight activities of booked flights and redeemed points.
E-Commerce Sales Dashboard
🔗Excel 🏷️sales e-commerce excel
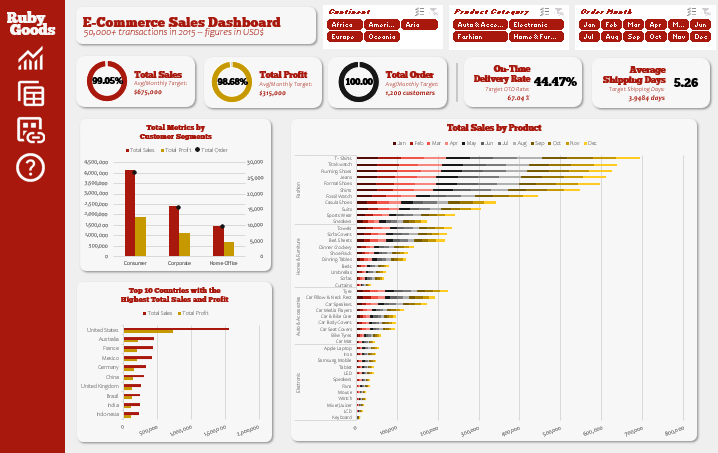
In this project I’m making a dashboard of 40,000+ e-commerce sales of 4 product categories in Excel. The dashboard takes in mind of tracking relevant metrics for sales and shipping, along with groups of category segments, top 10 countries, and unique products, and slicers to explore further insights by customer segments.
Inventory and Sales Dashboard: shop.arianagrande.com
🔗nbviewer 🏷️shopify inventory real-world-data power-bi
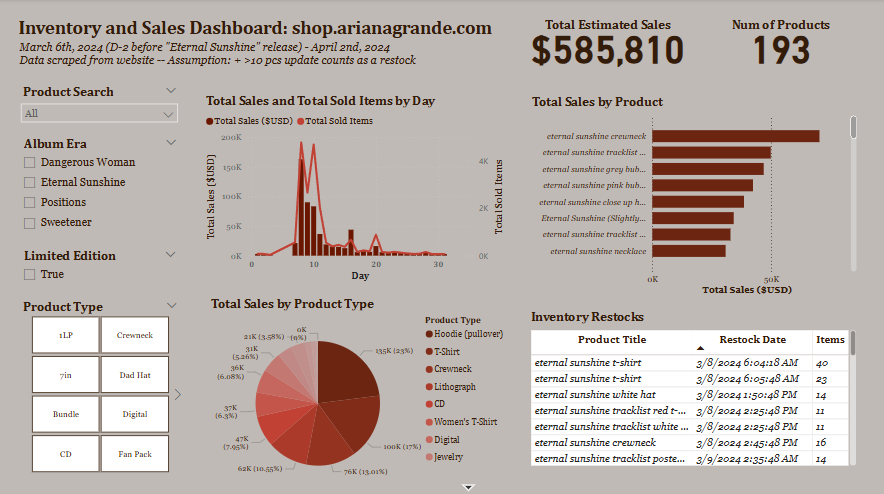
In this project I’m making a dashboard from a combined inventory data from shop.arianagrande.com within a timespan of 1 month since the latest album release “Eternal Sunshine”. The dashboard includes estimated sales for each product across the month along with distribution of sold products, variants, categories, restock histories, and album era.
DataCo Supply Chain Dashboard
🔗Tableau 🏷️e-commerce supply-chain big-data tableau
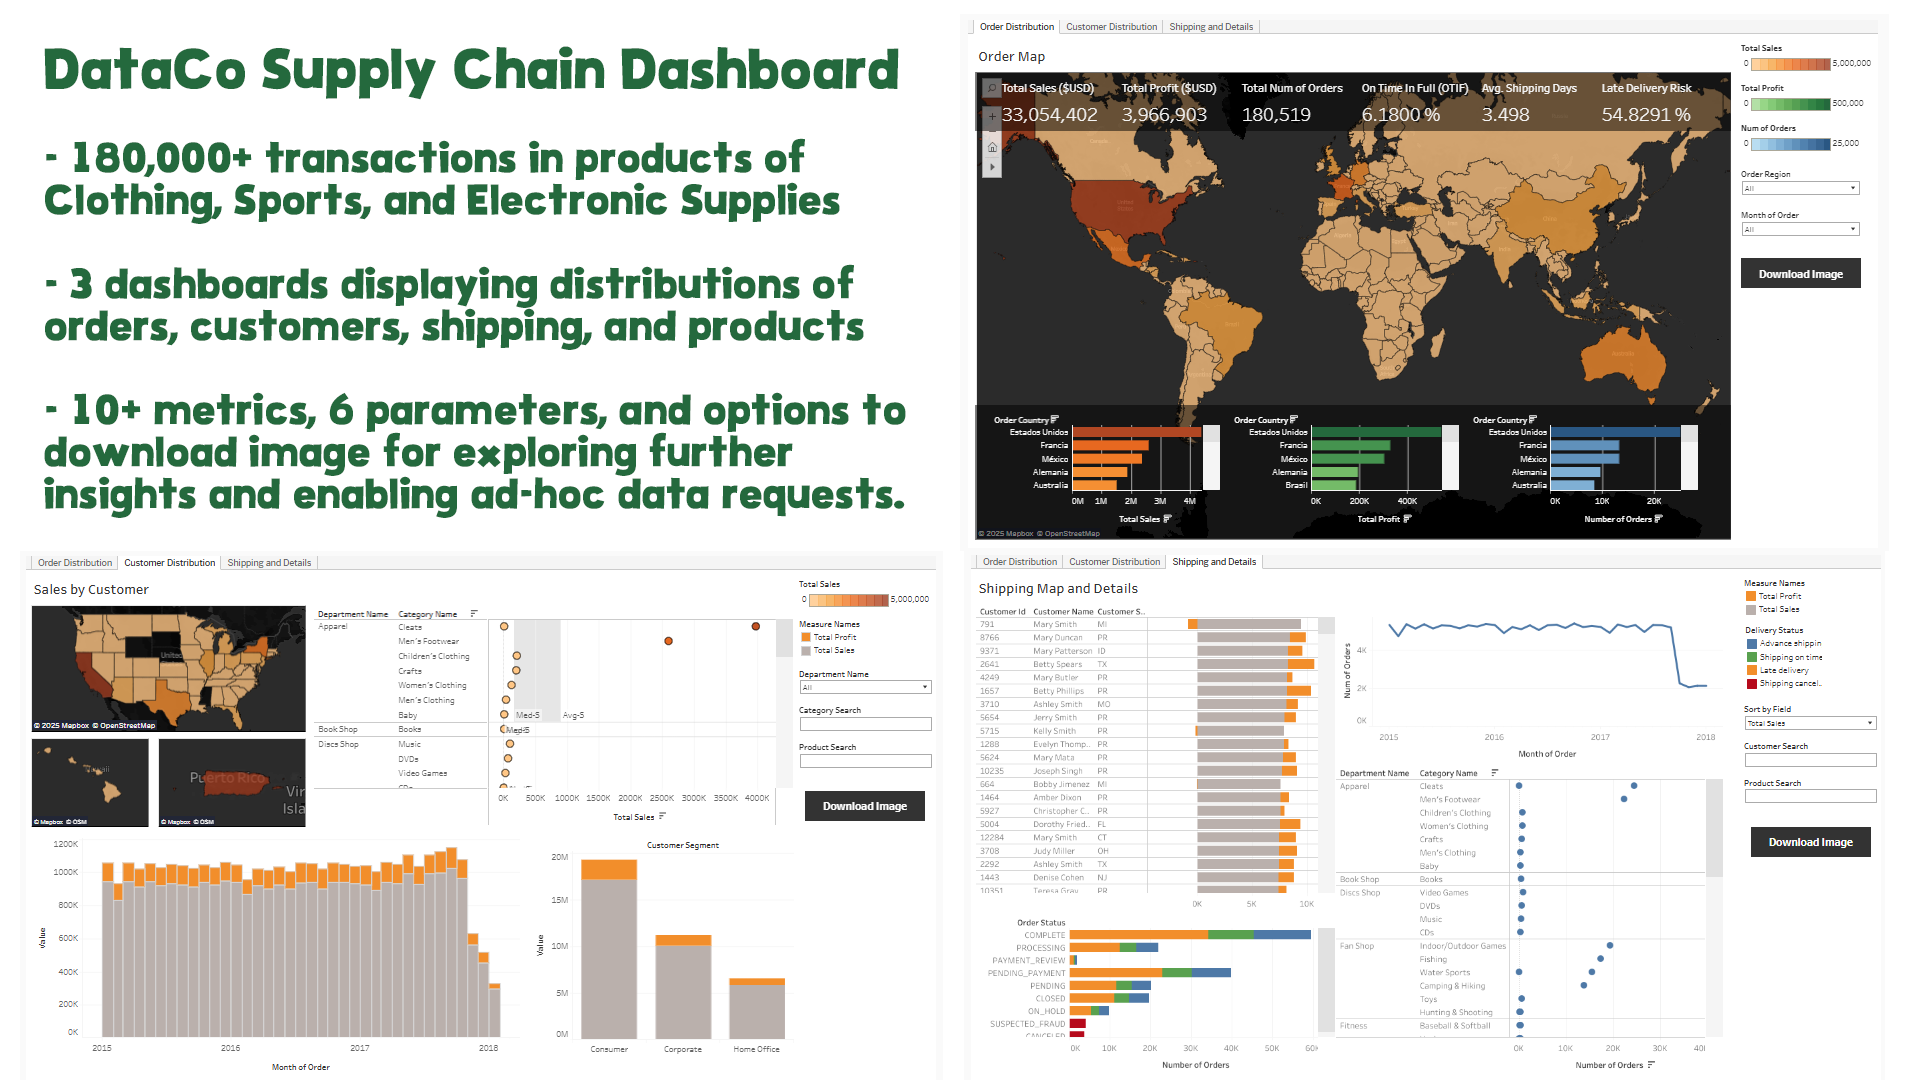
In this project I’m turning 180K+ transactions in a supply chain of multiple products into three dashboards displaying the distributions of orders, customers, products, and also shipping. It features 10+ metrics, 6 parameters, and options to download image of current findings–this could help in exploring further insights and enabling ad-hoc data requests.
Dashboard of Pharma Sales: Kimia Farma, Indonesia
🔗Looker 🏷️dashboarding pharma looker
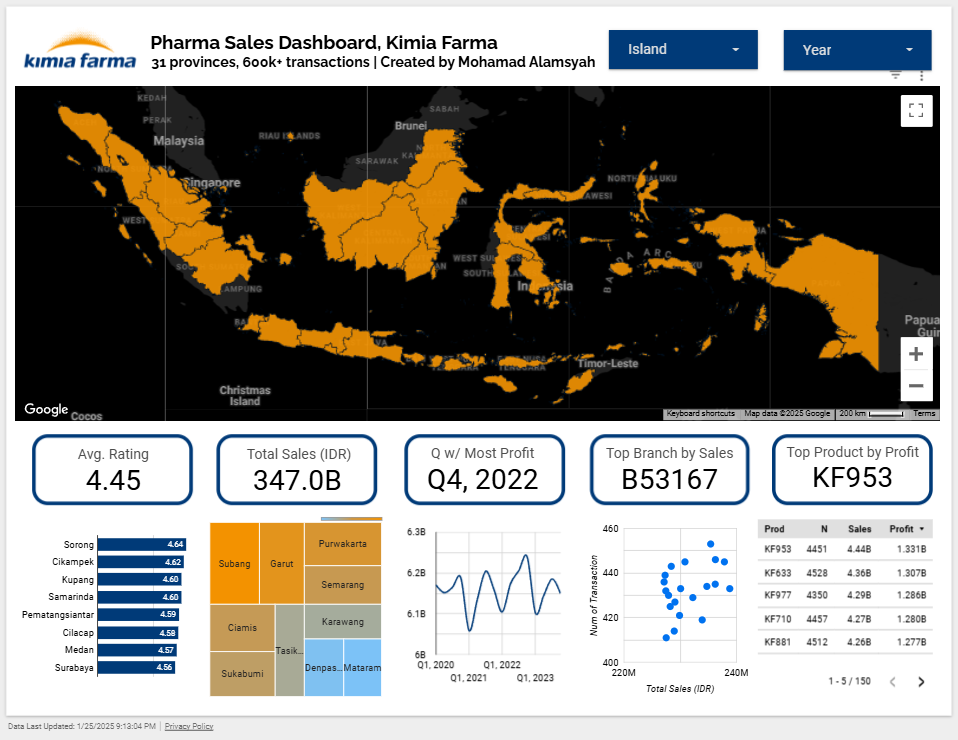
In this project I’m transforming 600K+ transactions of Kimia Farma, a pharma retail with 1500+ branches in 31 provinces across Indonesia, into a map-based dashboard with conveying metrics of ratings, branches, and products. The data is given from the company with its data anonymized to protect the tue nature of the business. The dashboard can be filtered by island, province, and city for further details.
SportsLogs: Sports Logging Web App Dashboard
🔗 nbviewer Github Streamlit 🏷️data-visualization dashboarding web-development sport Python Streamlit
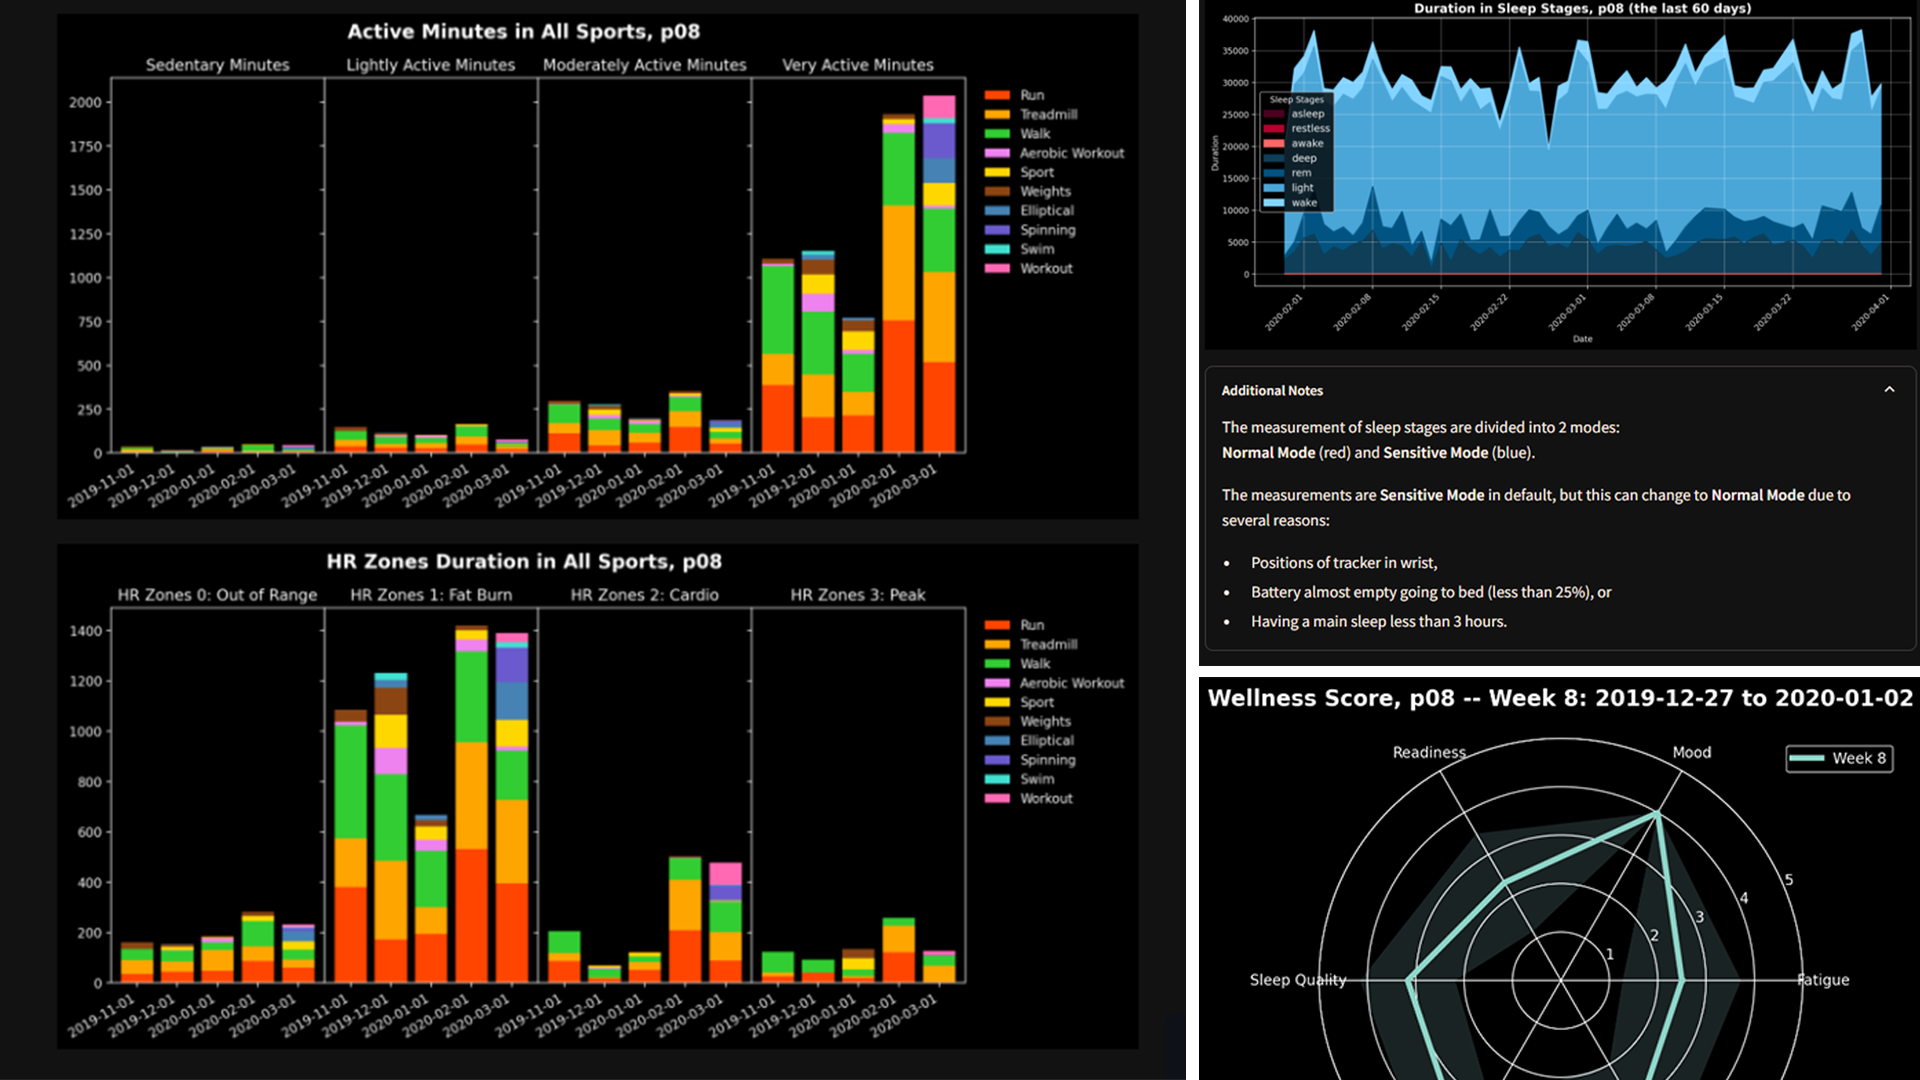
In this project I manage to process 10+ different datasets from biometric sensor (FitBit), sports logging (PMSys), and Google Docs into a list of dashboards visualizing the performance of 16 players. The web app is available to visualize the Whole Team (with limited data) and individual player (p01 - p16). The visuals varies from calories burned, active metrics in one player’s sport activities, sleep stages on a specific date, up to wellness score each week.
Alam’s Productivity Tracker
🔗Looker 🏷️dashboarding personal-project looker
![]()
This project utilizes a personal archive of daily Pomodoro sessions, task and language chunks, read books, and milestones for 450+ days from the website Studystream. The goal is to visualize how much Alam has gained across his journey–at times he doesn’t feel good about it. Glad it turned out neat, and I can add the data further as time goes.
YouTube Metrics Web App Dashboard
🔗Github Streamlit 🏷️data-visualization dashboarding web-development marketing business YouTube Python Streamlit
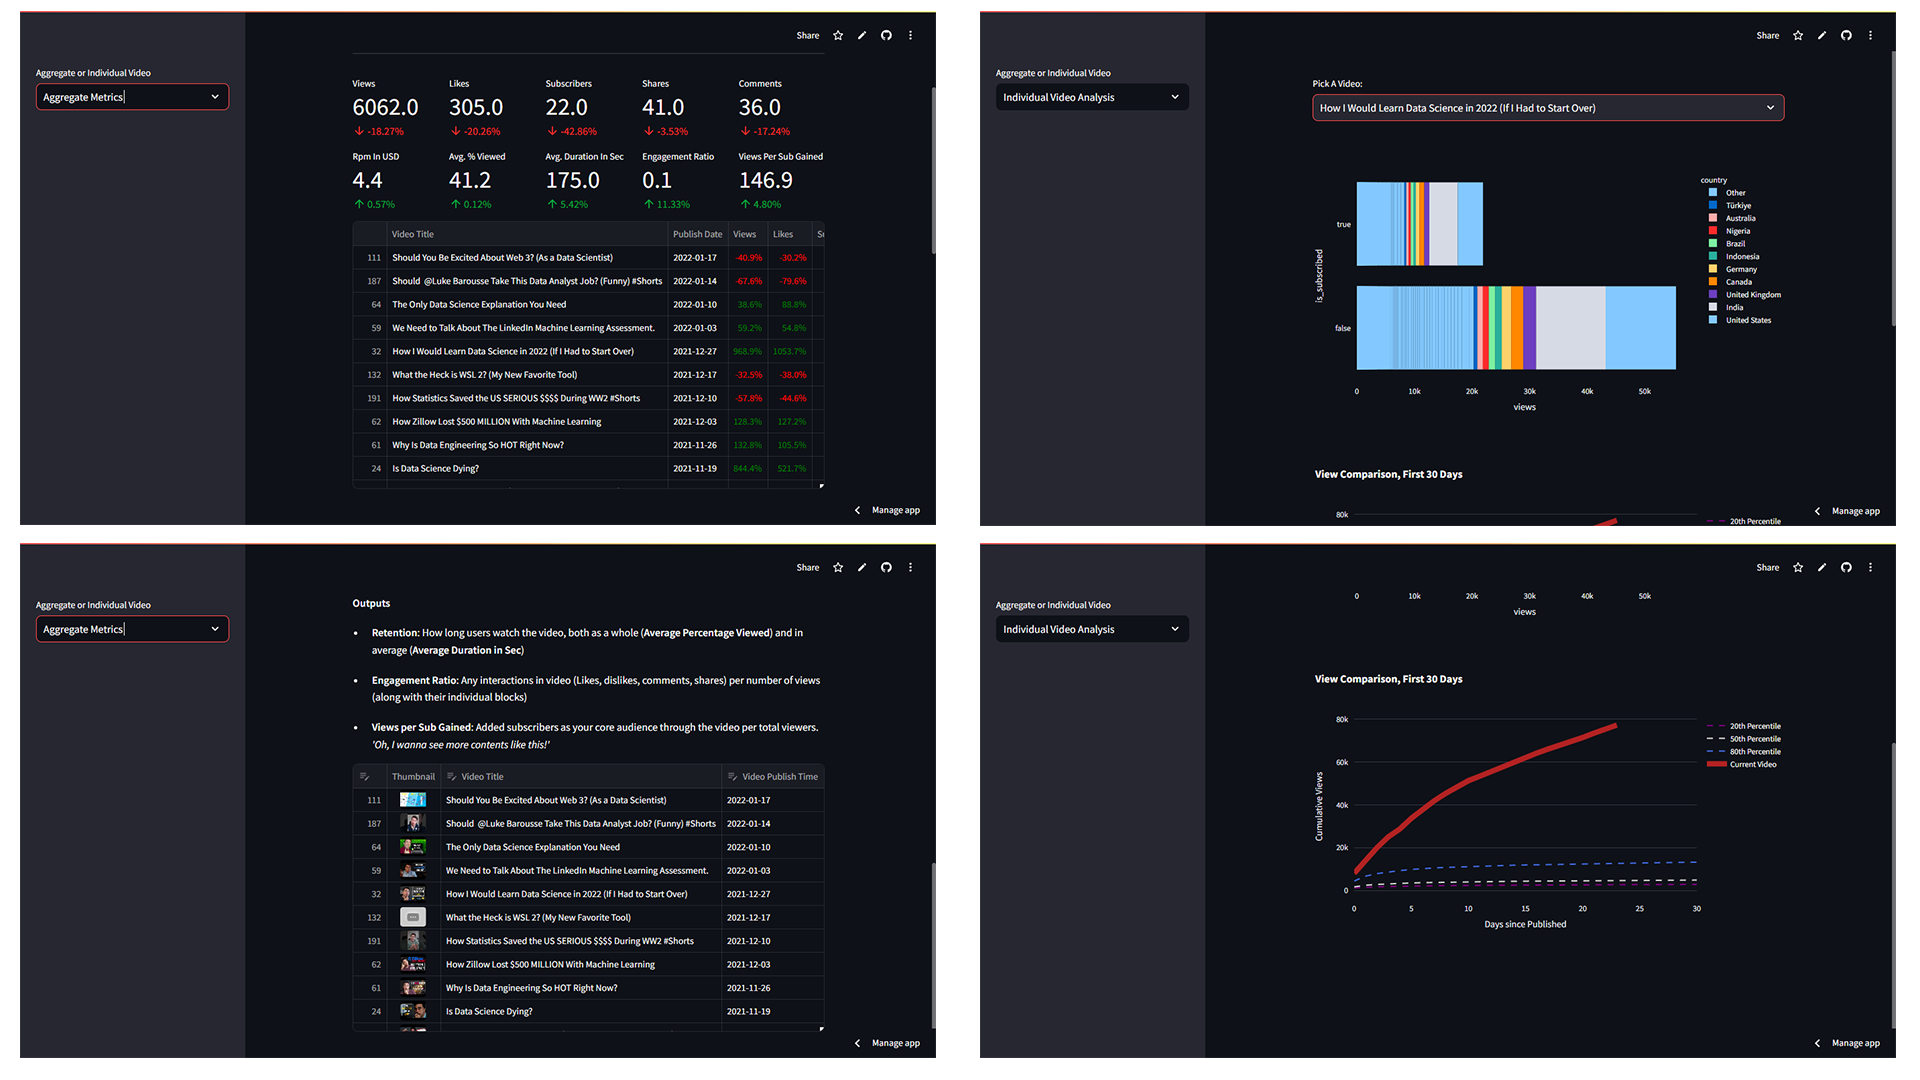
This project processes datasets of aggregated metrics by 200+ videos and country and subscriber status, along with comments and performance over time, into a web app dashboard with Python and Streamlit with two features: Aggregate Metrics for the whole channel, and Individual Video Analysis for deeper insights per video.
Data Platform for Automation in Drug Clearance Letter Generation
🔗📽️Loom 🏷️data-platform automation google-sheets google-app-script
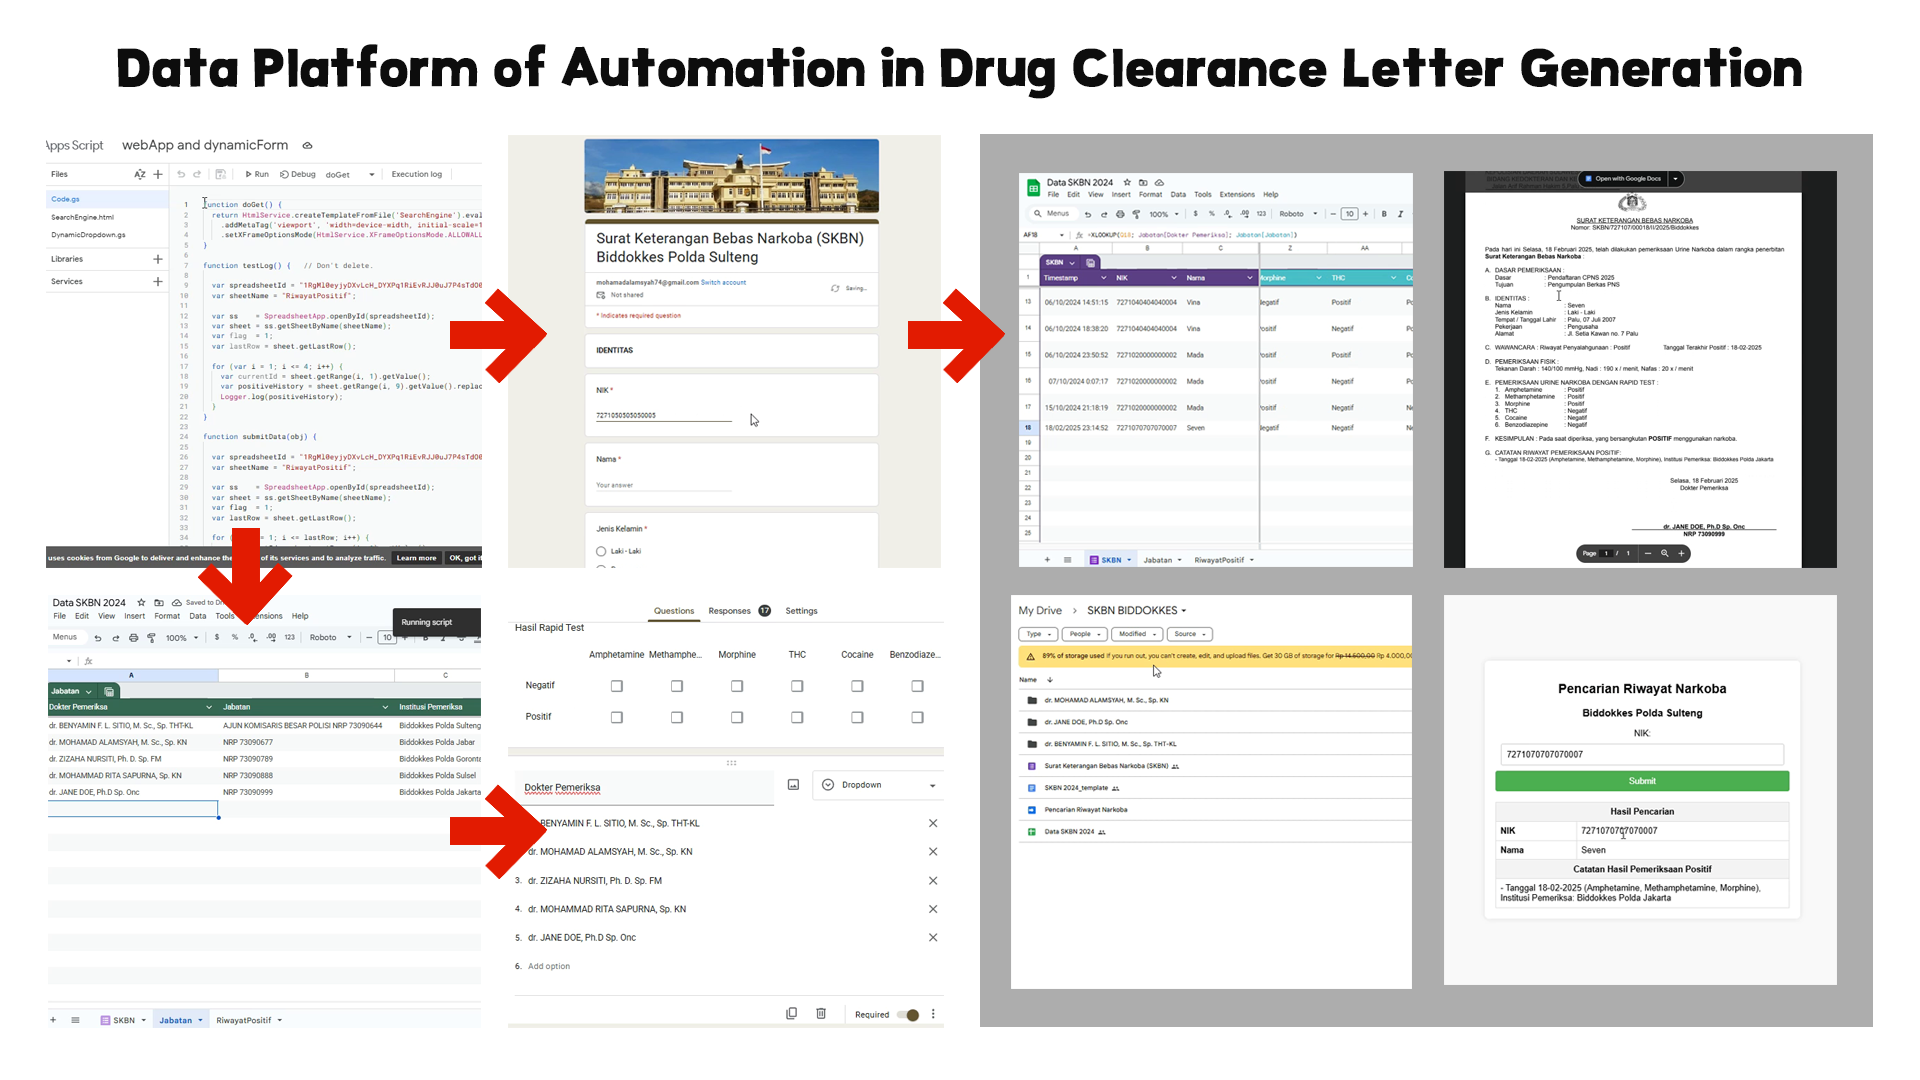
In this project I manage to create a data platform in generating a drug clearance letter by turning form inputs of drug test results in Google Forms into a document file assorted from the data. This project features Google Sheets for further data processing (with usage of REGEXMATCH, LET, VLOOKUP), Google Docs for document template, Google App Scripts for search engine by Citizen ID and dynamic markdown in Google Forms, and Google Drive for data storage grouped per medical provider.
Research Payments of Non-Covered Recipient Entity (NCRE) in the United States 2023
🔗Github | nbviewer: 01-data-cleaning 02-data-analysis-bigquery | Tableau: 03-research-payments-NCRE-2023 🏷️healthcare RnD CMS real-world-data BigQuery Python Tableau
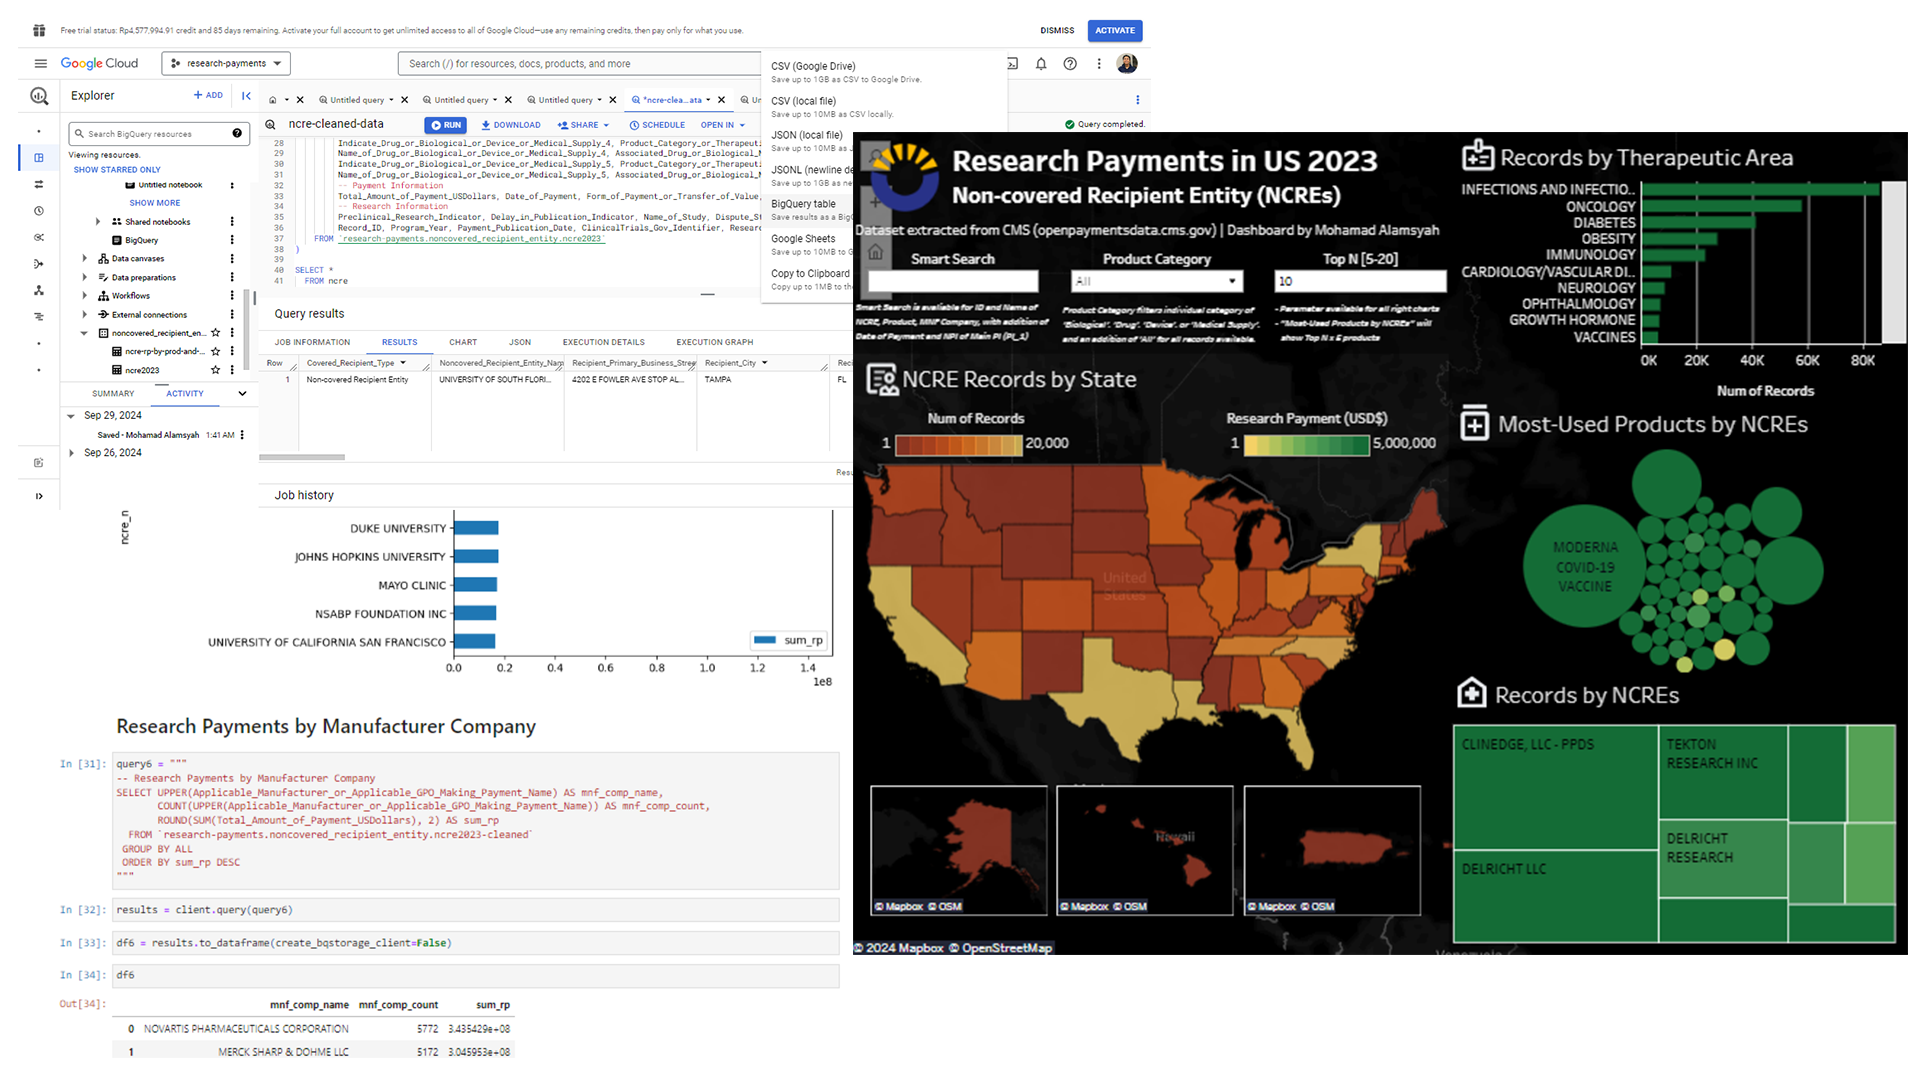
This project visualizes research payments of NCREs in form of a dashboard of Tableau connected with database of BigQuery. The dataset are taken from CMS Open Payments, then cleaned from ParsingError in Python, and analyzed through SQLs of BigQuery. The dashboard showcases NCRE records by state, and also research payments by therapeutic area, product, and NCREs. It also comes along with parameters of Smart Search, Product Category, and Top N [5-20].
Product Segmentation and Customer Classification in an Online Retail Company
🔗nbviewer 🏷️clustering k-means wordcloud pca machine-learning marketing-data-science
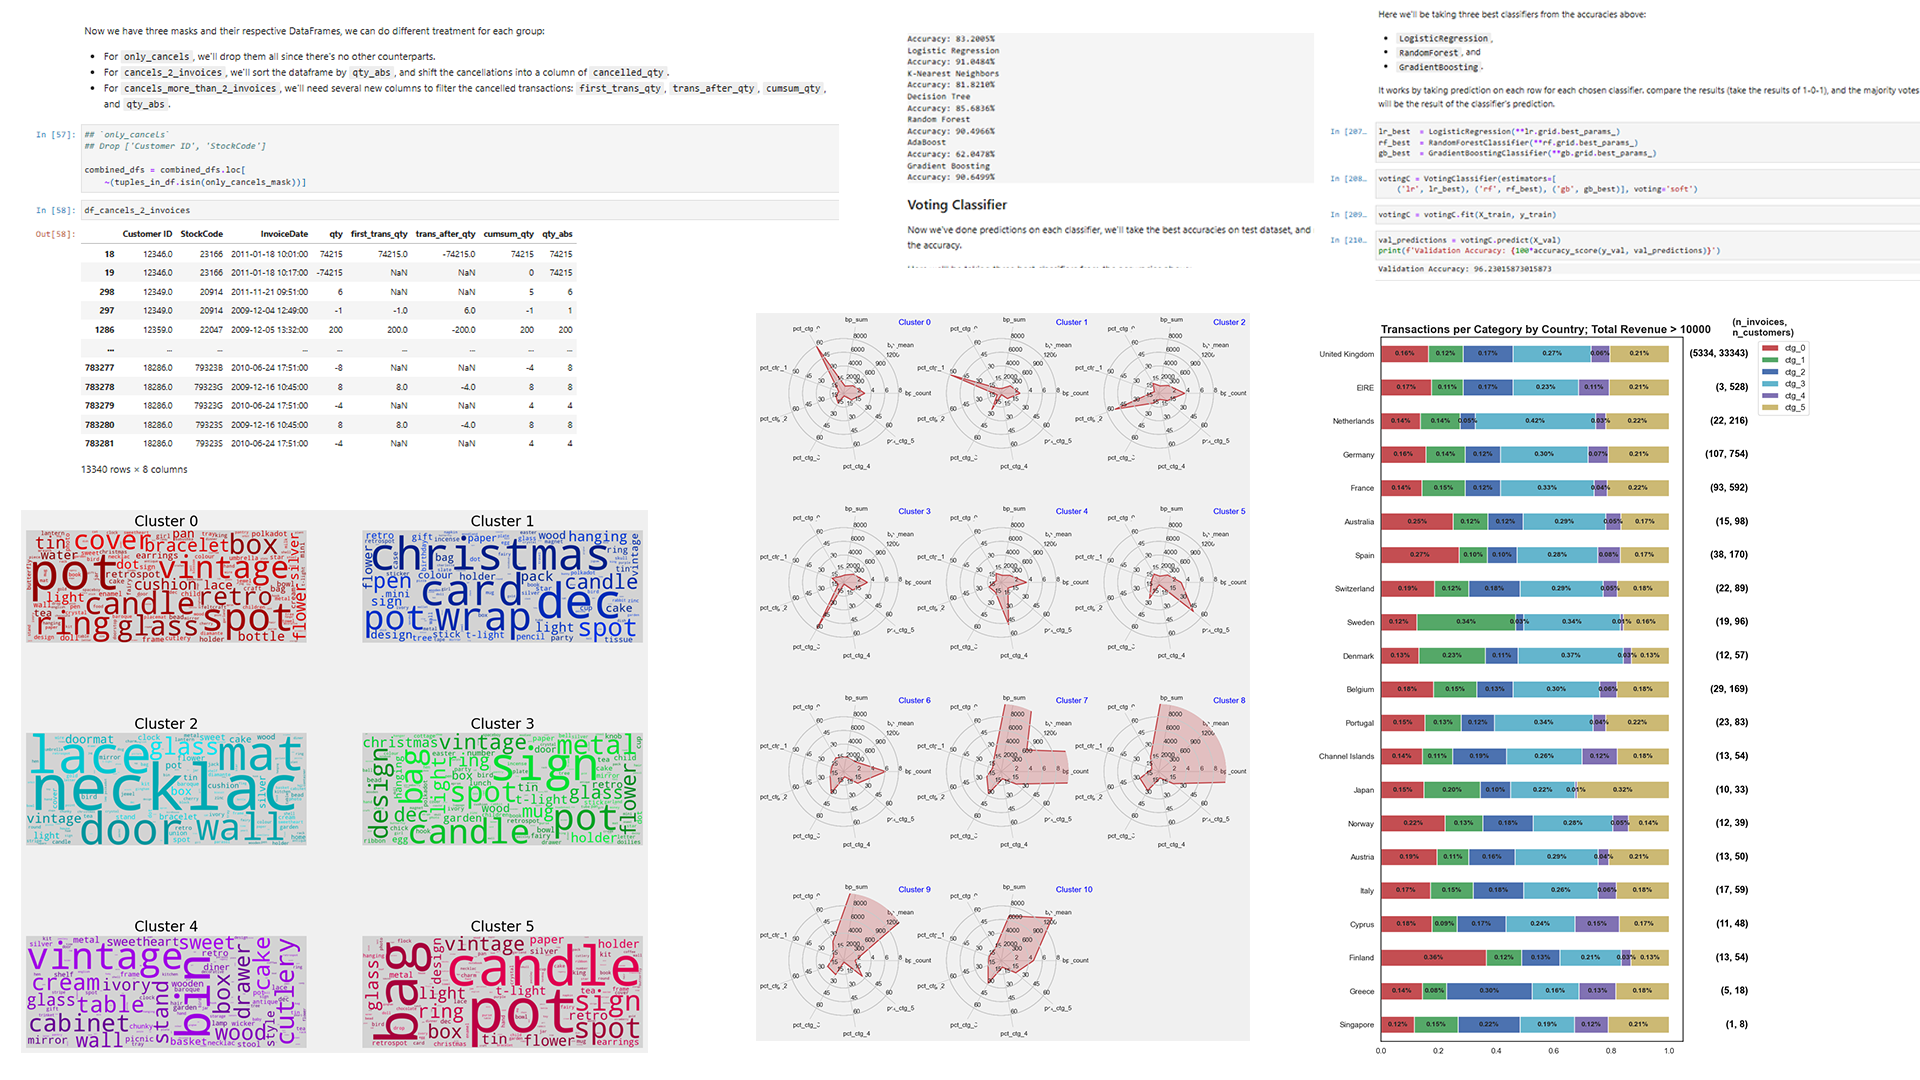
This project cleans 1M+ data of 2-year-transactions in a UK online retail company into 760K+ invoices with respective cancellations cleaned into a column, clusters the data into 6 categories of products and 11 categories of customers, and classify the test customers with a combination of 3 best models inside a VotingClassifier with an accuracy of 91.5696%.
A/B Testing: Commitment Check for Online Students in Udacity ✏️📈🔎
🔗nbviewer 🏷️a/b-testing data-analysis Python
Udacity conducts an experiment of commitment check by adding hours to devote per week before enrolling. This is to filter frustrated students who can’t make it due to time while retaining current profits. This project creates the experiment design, measures the changes through relevant metrics, and offers recommendation whether or not to launch the experiment.
Drug Reviews on drugs.com: Dashboard and Sentiment Prediction 💊📊⚙️
🔗 Github | Tableau (updated with BigQuery) | nbviewer:
01-EDA-and-data-cleaning 02-import-csv-to-postgresql 03-dashboard-of-drug-reviews 04-sentiment-prediction 🏷️big-data data-cleaning Python PostgreSQL BigQuery Tableau natural-language-processing
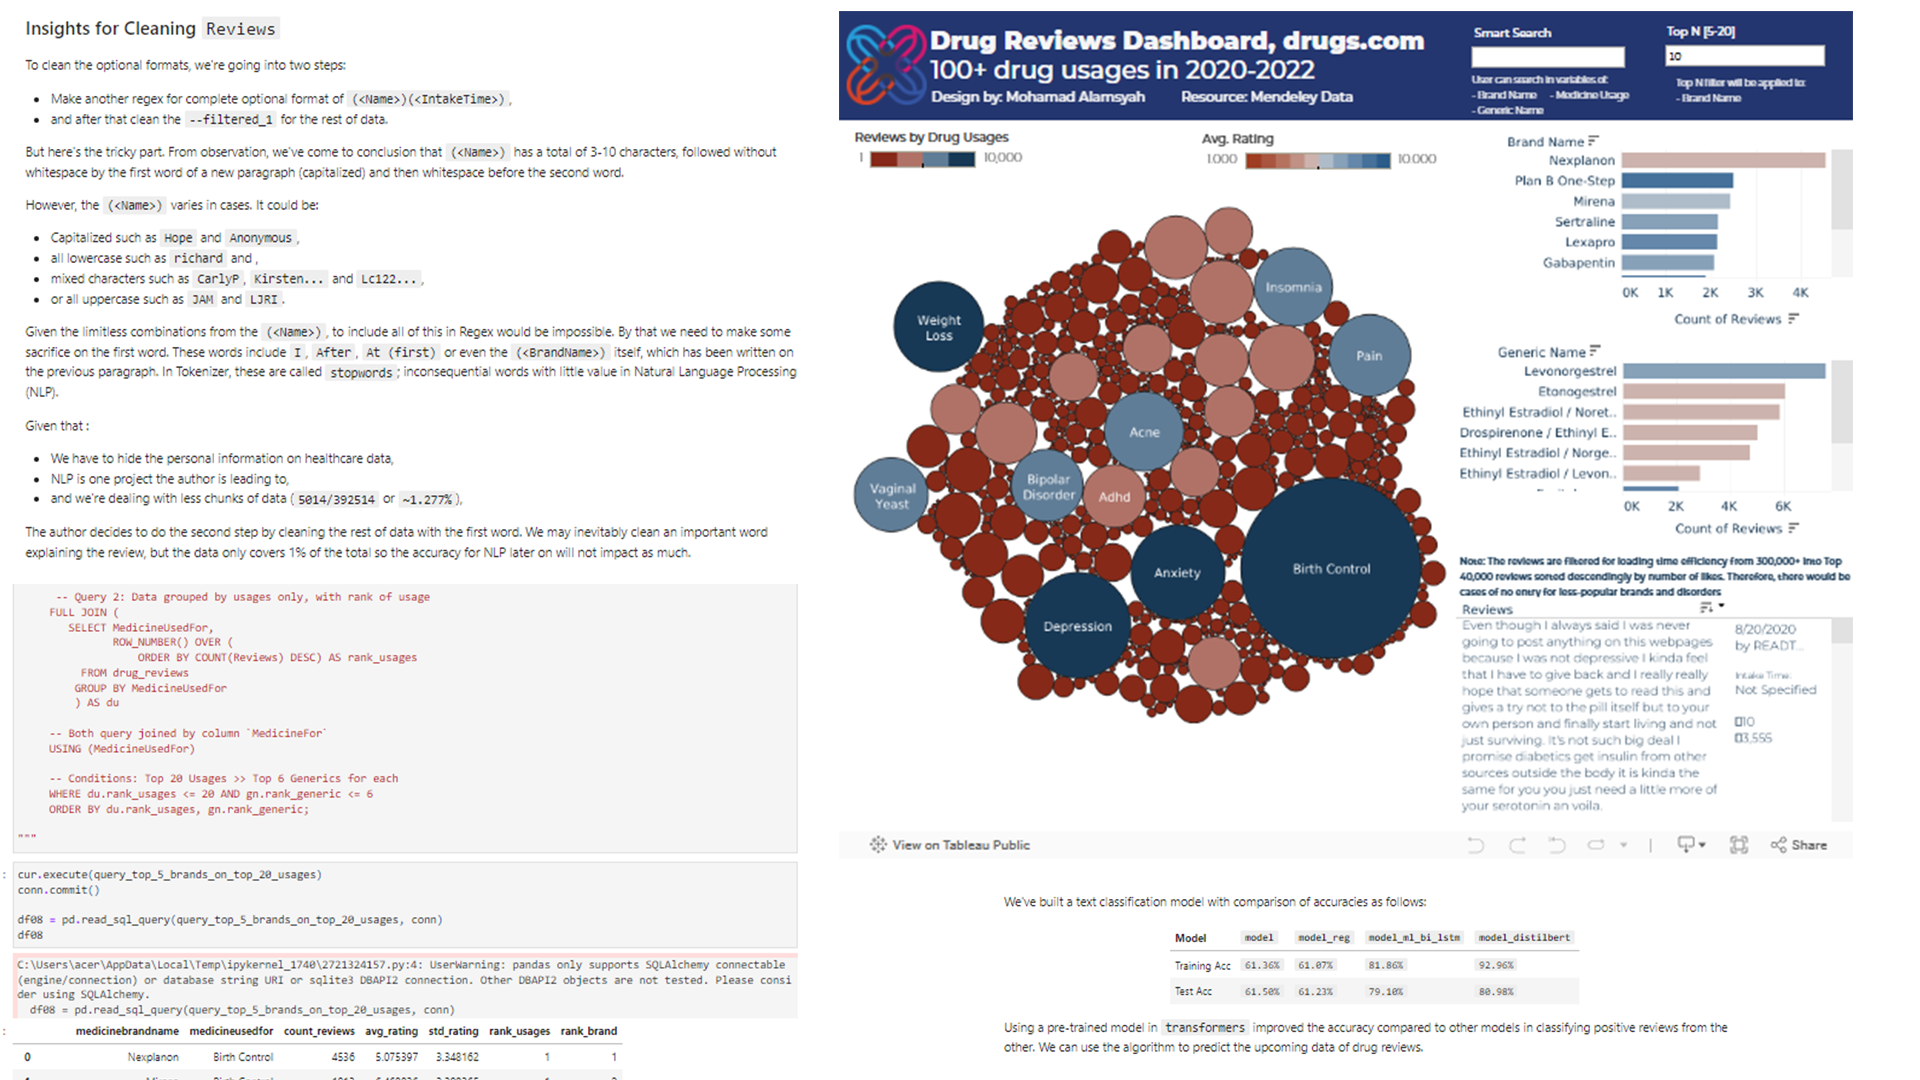
This project processes a 16-year dataset of drug reviews by 390,000+ consumers into 4 sections: data cleaning and exploration, database management in PostgreSQL, data visualization in Tableau, and sentiment prediction through deep learning and transformers.
Revenue Prediction via Customer Lifetime Values (CLV)
🔗Github | nbviewer: 01-EDA-and-data-cleaning 02-data-visualization 03-feature-engineering 04-revenue-prediction 🏷️big-data time-series-data forecasting machine-learning
This project predicts revenue via customer lifetime values such as RFM, total quantity, and time-related variables on a dataset of Online Retail in UK. The variables are extracted into 8 periods (each new period is made for every 2 months): 6-month window of data for features and the next 2-months of total revenue per customer as labels.
COVID-19 Spread in the United States 🗺️
🔗Tableau Public 🏷️data-analyst data-visualization dashboard
This project visualizes the spread of COVID-19 in the US daily in 2020-2023 from a dataset shared by Opportunity Insights Economic Tracker, with data sourced from New York Times (NYT), Centers for Disease Control and Prevention (CDC), and John Hopkins University (JHU). The dashboard consists of:
- top N (adjustable, 1-10) states with highest new cases of COVID-19 on a chosen day,
- options to look for a specific state by clicking on the state map,
- recent and current statistics of death, vaccination, and COVID-19 cases.
Analyzing COVID RNA Sequences 🧬🧪
🔗nbviewer 🏷️biopython bioinformatics
This project looks at COVID RNA sequences consists of reference first sample in Wuhan, China, Asia and also the first sample in North America, and two of emerging mutant variants on the period of time: Delta and Omicron. The project shows how to download and parse the target sequences, align them to find similarities towards the reference, and then applying alignments to find mismatches in the base sequences.
Predicting Hepatitis C 🧪🩺🌟
🔗nbviewer 🏷️machine-learning healthcare-data
This project predicts patients of Hepatitis C based on a dataset of laboratory blood test using nine models of machine learning: RandomForest(), Support Vector Machine SVC(), up to GradientBoosting() and VotingClassifier()
Predicting MVPs in NBA Seasons 🏀🏆🌟
🔗GitHub | nbviewer: 1-web_scraping 2-data_cleaning 3-mvp_predictions 🏷️web-scraping machine-learning real-world-data
This project predicts MVP in NBA seasons in 2020 to 2023 through three steps: collecting the data via web scraping in the website, data cleaning for training model purposes, and MVP predictions using three models of machine learning: Ridge(), RandomForest(), and GradientBoosting().
Detecting Pneumonia in X-Ray Images 🫁🩻
🔗nbviewer 🏷️deep-learning transfer-learning biomedical-image-processing
This project detect patients with pneumonia through a dataset of patients’ X-Ray images by utilizing Deep Learning, specifically convolutional neural network CNN and Transfer Learning of ResNet50V2.
Classifying Real and Fake Disaster Tweets 🔎📲
🔗GitHub 🏷️deep-learning natural-language-processing
This project classifies real and fake disaster tweets through natural language processing. Besides word visualization on both kinds, the models used include shallow and deep neural networks, and also transformer model of distilcase-bert-uncased.
Time-Series Trade Forecasting ⌚📈
🔗nbviewer 🏷️deep-learning sequence-models
This project forecasts future trades of stocks in Yahoo! Stock Price using deep learning models: Recurrent Neural Network RNN(), Long-Short Term Memory LSTM(), convolutional layer Conv1D(), and also hyerparameter tuning to optimize the model’s accuracy in forecasting.
Predicting Listing Gains of the Indian IPO Market 💰🪽
🔗nbviewer 🏷️deep-learning neural-network
This project predicts companies that has listing gains across the Indian IPO market from a dataset of moneycontrol consisting of company names with its issues size and price and subscriptions from several entities. It begins from data exploration and visualization, treatment of outliers, and defining the classification model with deep neural network.
Classifying Heart Disease 📂🫀
🔗nbviewer 🏷️machine-learning logistic-regression
This project classifies a patient of heart disease through several features by using LogisticRegression(). The dataset is from the UCI Machine Learning Repository which includes several medical characteristics on each patient, including resting blood pressure, fasting blood sugar, up to ST depression induced by exercise and number of major vessels colored by spectroscopy.
Optimizing Model Prediction ⚙️📈
🔗nbviewer 🏷️ machine-learning forward-selection backward-selection
This project compares several models on LinearRegression() that include: SequentialFeatureSelector of Forward Selection and Backward Selection, RidgeCV, and LassoCV. The dataset used consists of feature that results in area of damage in a forest. We’re using wind (Wind speed) and temp (Temperature) as columns for reference model, all column the numerical values for regularized models of RidgeCV and LassoCV, and we’ll cherrypick the best 2-6 features on forward and backward selection accordingly.
Predicting Employee Productivity 🧑🏭💹
🔗nbviewer 🏷️machine-learning random-forest
This project predicts productivity of garment factory employees using a model of DecisionTreeClassifier() and RandomForestClassifier() to get the strongest predictors. The dataset is from the UCI Machine Learning Repository which includes several aspects from day, team number, up to standard minute value for a task and incentive. This could give insights to managers regarding aspects that can influence actual productivity compared to the target, from time spent for a garment, up to incentives and over-working time.
Predicting Heart Disease 🔮🫀
🔗nbviewer 🏷️machine-learning k-nearest-neighbors
This project predicts a patient of getting a heart disease from several features by using k-Nearest Neighbors (k-NN) or KNeighborsClassifier(). The dataset includes relevant information for each patient, from their personal information up to relevant medical data.